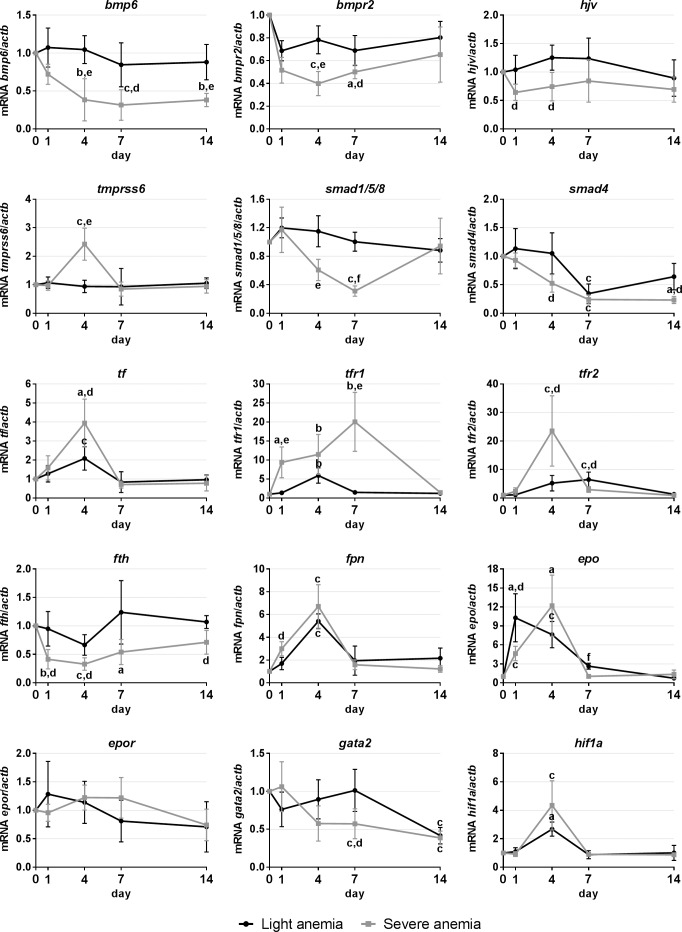
Fig 3. Gene expression in the liver, after 1, 4, 7 and 14 days of experimental anemias.
Genes analyzed include genes encoding for hematopoietic transcription factors (gata2) and erythropoiesis-related factors (epo/epor), from the two major pathways of iron-sensing (tmprss6/hjv/bmp6/bmpr2/smad and tf/tfr1/tfr2), for response to hypoxia (hif1a), iron storage (fth) and iron export (fpn). Values are presented as mean ± SD (n = 4). Differences were considered significant between control and treated groups as a, p<0.05; b, p<0.01; c, p<0.001; and between treated groups as d, p<0.05; e, p<0.01; f, p<0.001.

