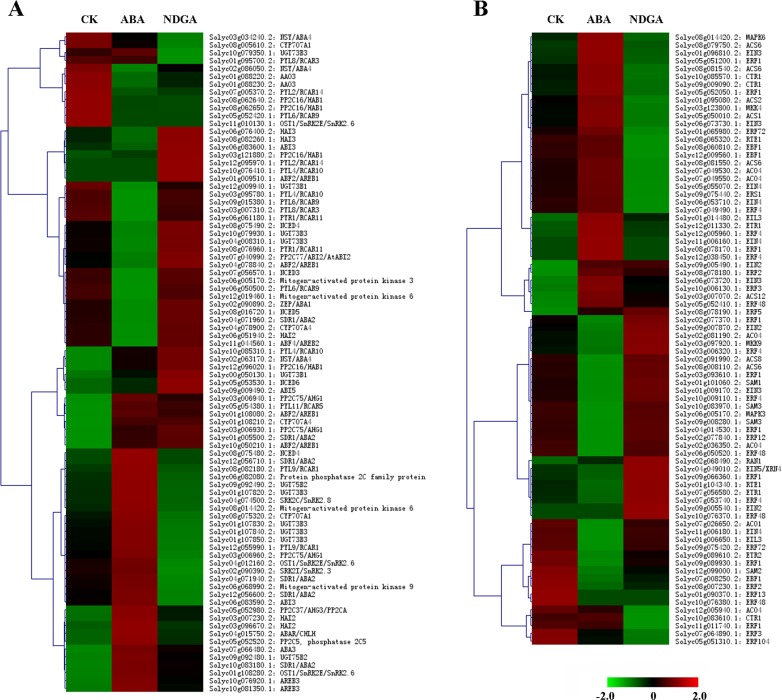
Fig 2. The overall transcriptional profiles of genes involved in biosynthesis and signaling of ABA and ethylene, respectively.
(A) The Fig showed an overview of genes expression related to ABA biosynthesis, deactivation and signaling in different treatments. (B) The Fig showed an overview of genes expression related to ethylene biosynthesis and signaling in different treatments. Analysis of the relative gene expression value (Z-score) was performed using the heatmap command in MEV 4.9.0. Red and green colors indicate relative higher and lower expression values, respectively.

