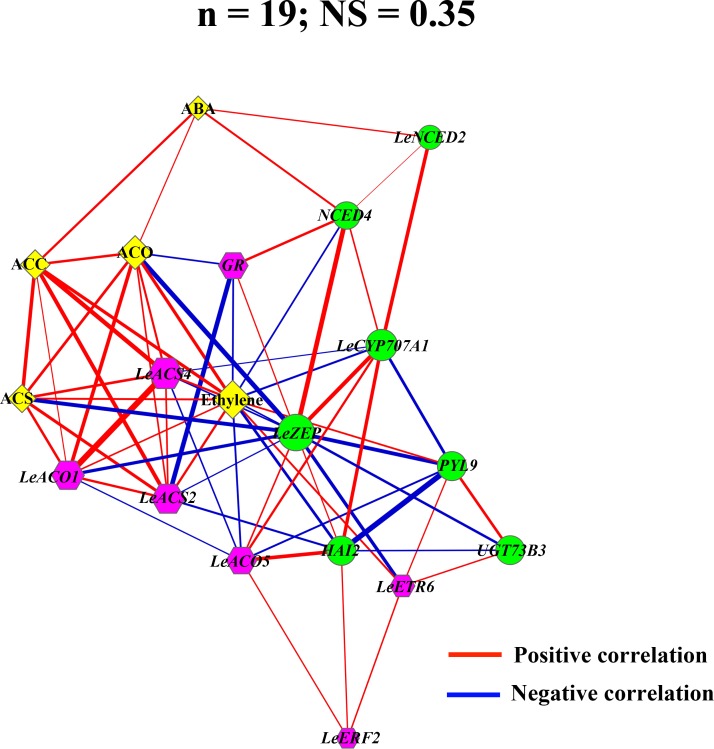
Fig 10. Correlation networks of transcripts and metabolites related to ABA and ethylene.
The network diagram is visualized as “organic” layout, with different node shapes representing ABA-related genes (green ellipses), ethylene-related genes (pink hexagons) and metabolites (yellow diamonds). Edges joining the nodes correspond to correlations (| ρ | ≥ 0.40), and positive (ρ > 0) as well as negative (ρ < 0) correlations are shown in red and blue, respectively. Edge thickness is proportional to the| ρ |, while node sizes are proportional to node strengths (ns) which were shown in S11 Table. The number of nodes (n) and network strength (NS) are shown on top of the network.

