
FIGURE 1.
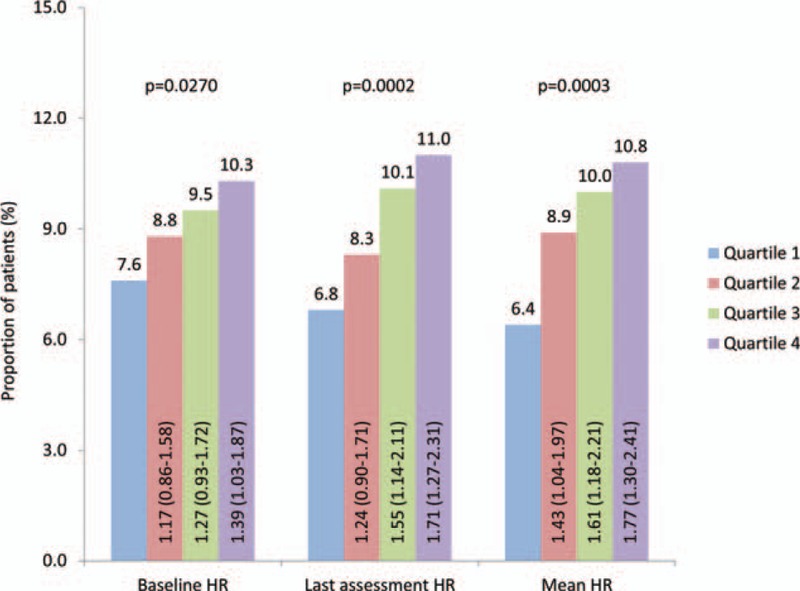
Frequency of new-onset microalbuminuria according to heart rate. Odds ratios (OR) with 95% confidence intervals (CI). Columns compare Quartiles 2, 3, and 4 with Quartile 1. P values derived from a Cochran–Armitage test for trend.
Official websites use .gov
A
.gov website belongs to an official
government organization in the United States.
Secure .gov websites use HTTPS
A lock (
) or https:// means you've safely
connected to the .gov website. Share sensitive
information only on official, secure websites.
Frequency of new-onset microalbuminuria according to heart rate. Odds ratios (OR) with 95% confidence intervals (CI). Columns compare Quartiles 2, 3, and 4 with Quartile 1. P values derived from a Cochran–Armitage test for trend.