
FIGURE 3.
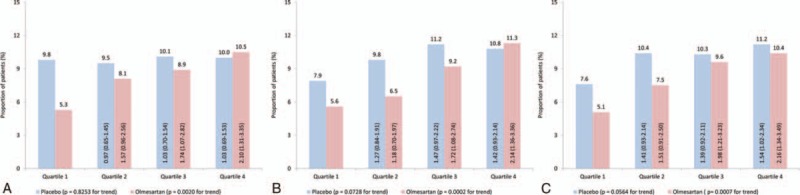
Frequency of new-onset microalbuminuria according to heart rate by treatment group. Frequency of new onset MAU during double-blind period according to (A) baseline HR, (B) last assessment HR, and (C) mean HR, in the placebo and olmesartan groups. Odds ratios (OR) with 95% confidence intervals (CI). Columns compare Quartiles 2, 3, and 4 with Quartile 1 within the placebo or olmesartan groups. P values derived from a Cochran–Armitage test for trend.