
FIGURE 2.
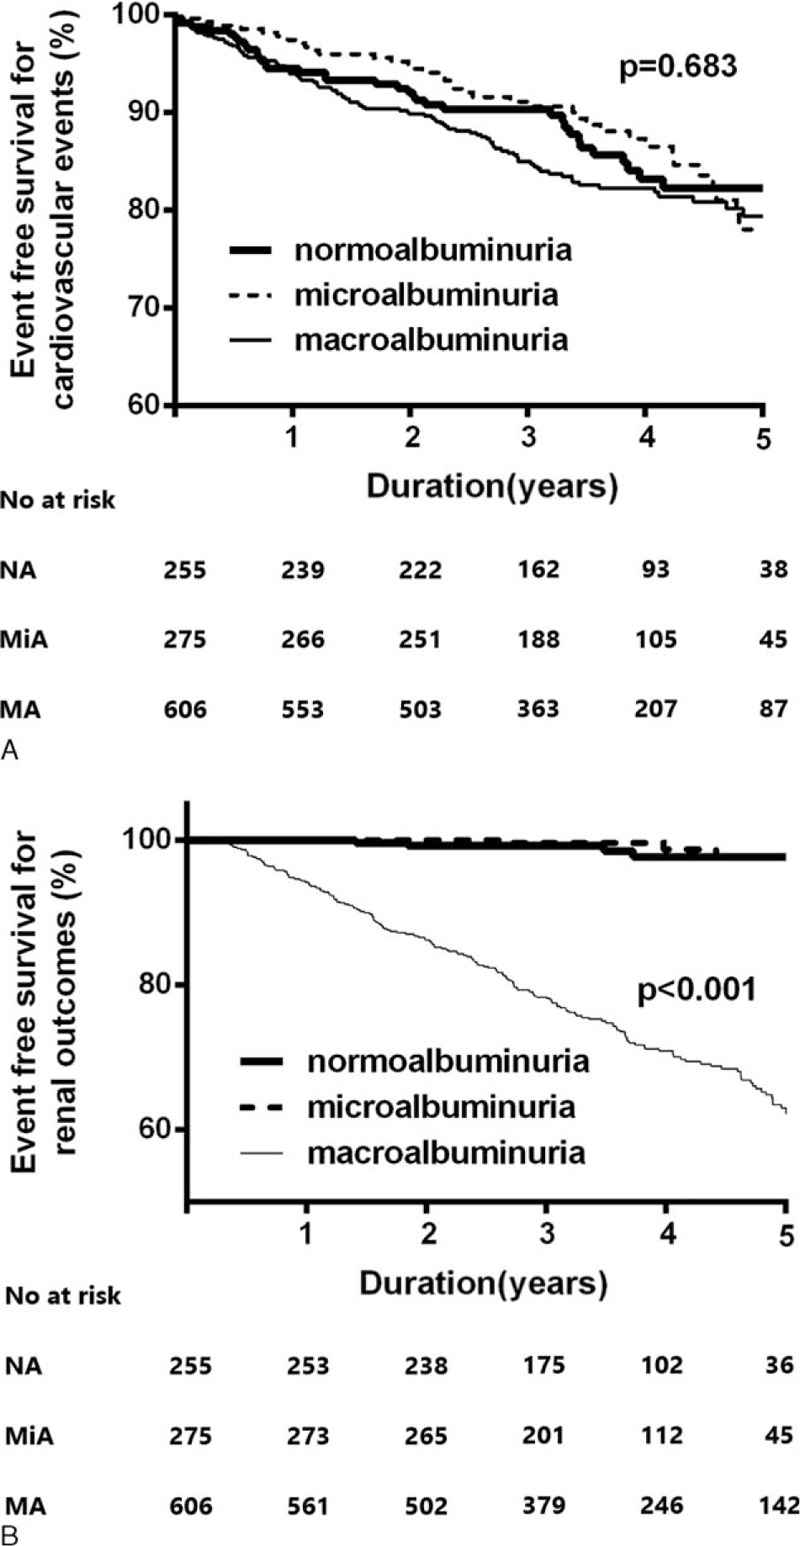
Kaplan–Meier plots for cardiovascular outcomes (A) and renal outcomes (B) according to the amount of albuminuria. New-onset cardiovascular events are comparable among the three groups (P = 0.68). However, macroalbuminuric patients have a significantly higher risk of renal outcomes (defined by a 50% decline in eGFR or ESRD) compared with patients with normoalbuminuria and microalbuminuria (P < 0.001).