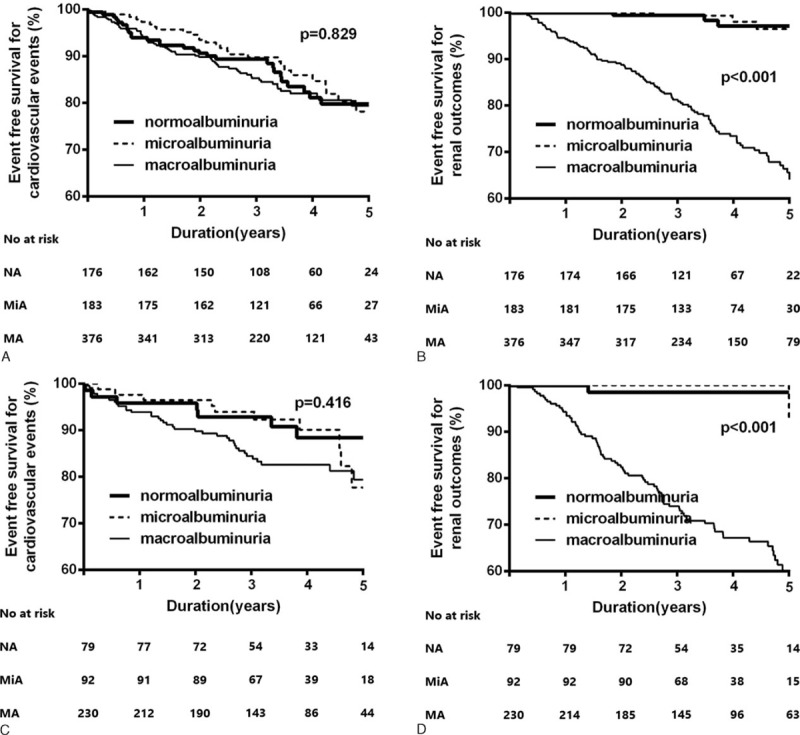
FIGURE 3.

Kaplan–Meier plots for cardiovascular outcomes (A) and renal outcomes (B) according to the amount of albuminuria in patients with good glycemic control (≤8%) and cardiovascular outcomes (C) and renal outcomes (D) according to the amount of albuminuria in patients with poor glycemic control (>8%). Cardiovascular outcomes are not different among the three groups in both good glycemic control group (P = 0.83) and poor glycemic control group (P = 0.42). The renal outcomes in the macroalbuminuria group are significantly higher compared with those of the normo- and microalbuminuria groups in both good glycemic control group (P < 0.001) and poor glycemic control group (P < 0.001).
