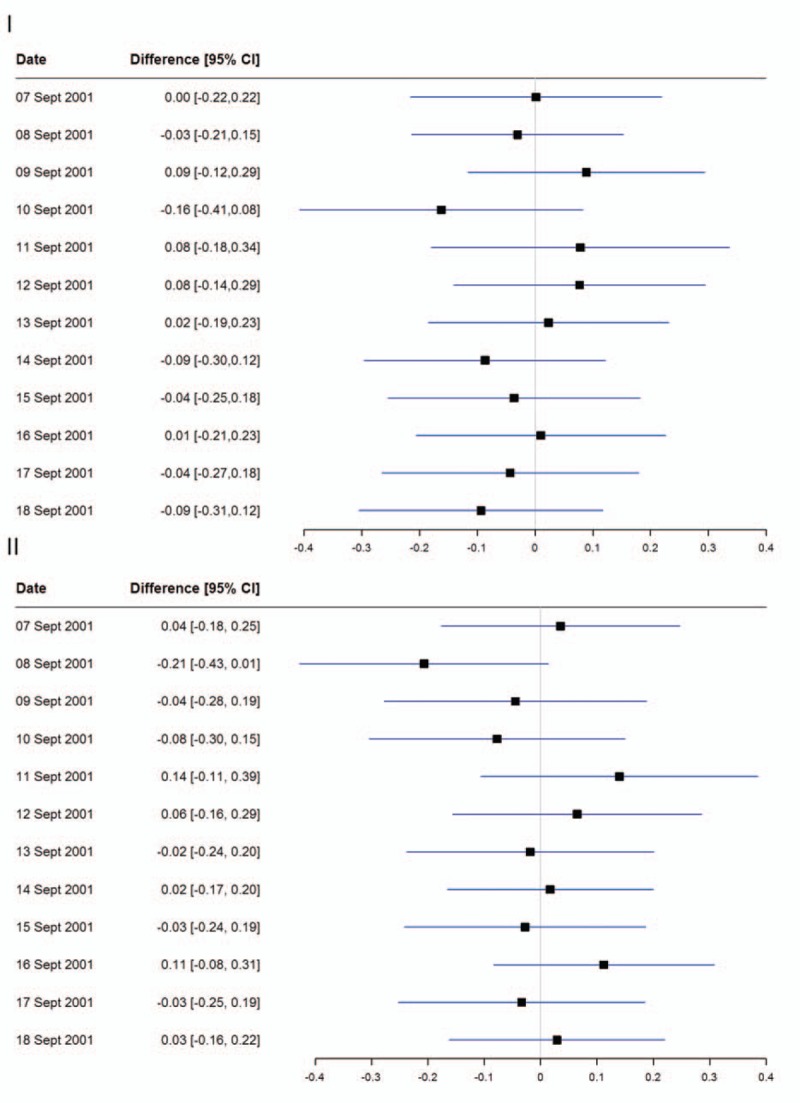
FIGURE 2.

Forest plot of the difference in daily suicide rates between 2001 and 2000 (I)/2002 (II). The forest plot shows the effect estimates as absolute differences after age and sex standardization using the new European standard population.

Forest plot of the difference in daily suicide rates between 2001 and 2000 (I)/2002 (II). The forest plot shows the effect estimates as absolute differences after age and sex standardization using the new European standard population.