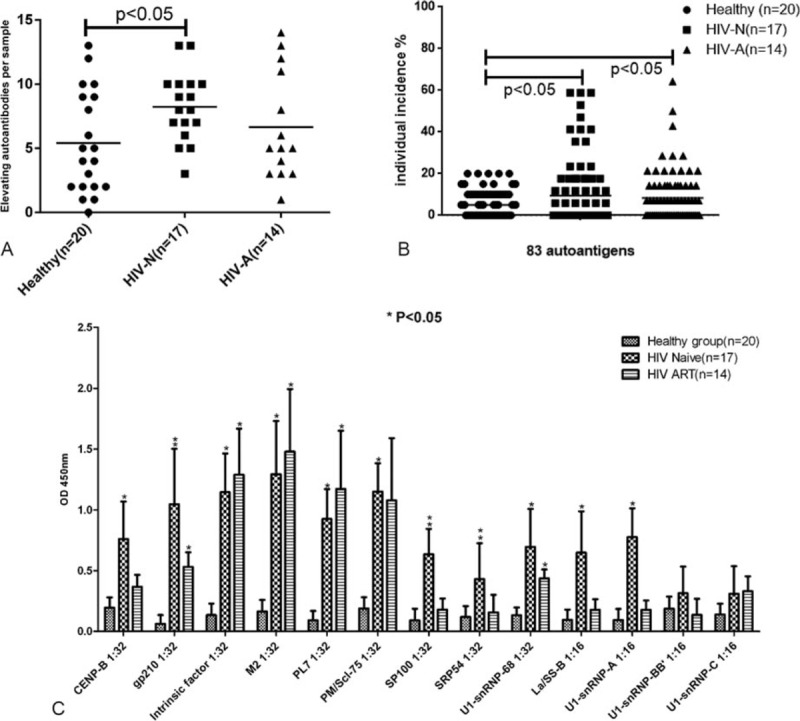
FIGURE 2.

Comparative analysis of quantity and individual incidence of elevated autoantibodies in 3 groups and confirmation of varied autoantibodies levels detected by Microarray and by ELISA. (A) The quantity of elevated autoantibodies per sample in healthy groups, HIV patients without treatment, and HIV patients on ART. (B) Incidence of autoantibodies in healthy group, HIV patients without treatment and HIV patients with ART, respectively. (C) ELISA confirmation of plasma autoantibody against 13 autoantigens. Serial dilution was used to determine the final titer of autoantibodies in plasma, and 2-folds of the averaged negatives were considered as the cutoff. Data are presented as mean average ± SD for each of the antigens analyzed. A P-value less than 0.05 was considered statistically significant. ∗Significant difference between HIV patients and healthy control, ∗∗significant difference between HIV patients on ART groups and HIV patients without treatment as well as healthy control. ART = antiretroviral therapy, ELISA = enzyme-linked immunosorbent assay, HIV = human immunodeficiency virus, SD = standard deviation.
