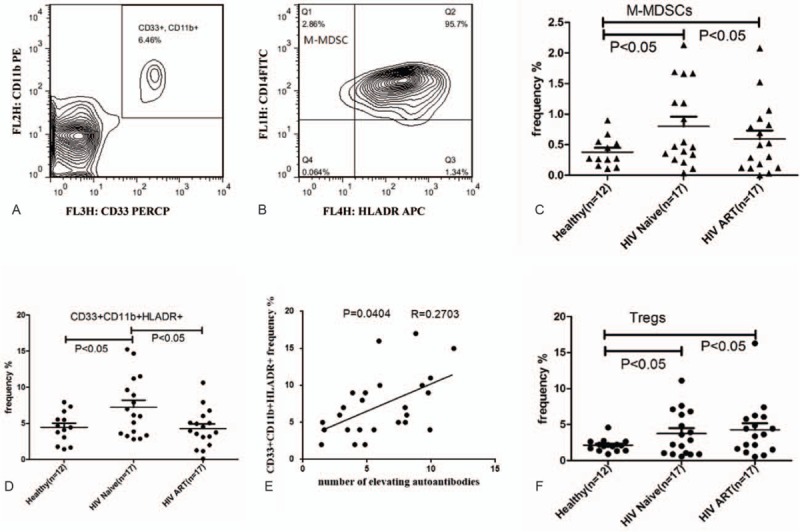
FIGURE 4.

Frequency of CD33+CD11b+ cells, monocytic MDSCs, granulocytic MDSCs, CD33+CD11b+HLA-DR+ cells, and Tregs in peripheral blood of healthy controls and HIV infected individuals. (A, B) Gating strategy of M-MDSCs and G-MDSCs by flow cytometric analysis. CD11b+CD33+/high cells were first selected from live PBMCs (A), and the CD14+/HLA-DR−/low population as M-MDSC (B). (C, D, F) Comparison of M-MDSCs, CD33+CD11b+HLA-DR+ cells, and Tregs between HIV-infected ART-naive individuals, healthy controls, and HIV-infected individuals on ART. ∗P < 0.05: statistically significant difference from controls. (E) Correlation between CD33+CD11b+ cells frequencies and signal intensity of 12 autoantibody titers by microarray (NFI) (r2 = 0.2703, P = 0.0404; linear regression). ART = antiretroviral therapy, HIV = human immunodeficiency virus, MDSC = myeloid-derived suppressor cell, NFI = net fluorescent intensity.
