
FIGURE 1.
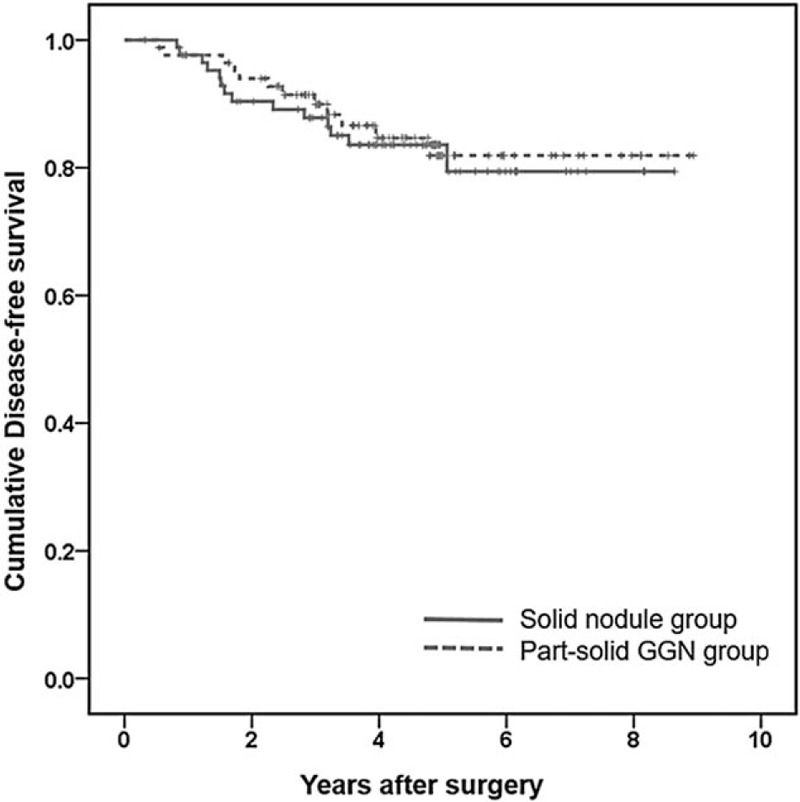
Kaplan–Meier survival curves for DFS of the solid nodule group (red) and part-solid GGN group (green). No statistically significant difference was observed between the 2 groups.
Official websites use .gov
A
.gov website belongs to an official
government organization in the United States.
Secure .gov websites use HTTPS
A lock (
) or https:// means you've safely
connected to the .gov website. Share sensitive
information only on official, secure websites.
Kaplan–Meier survival curves for DFS of the solid nodule group (red) and part-solid GGN group (green). No statistically significant difference was observed between the 2 groups.