
FIGURE 3.
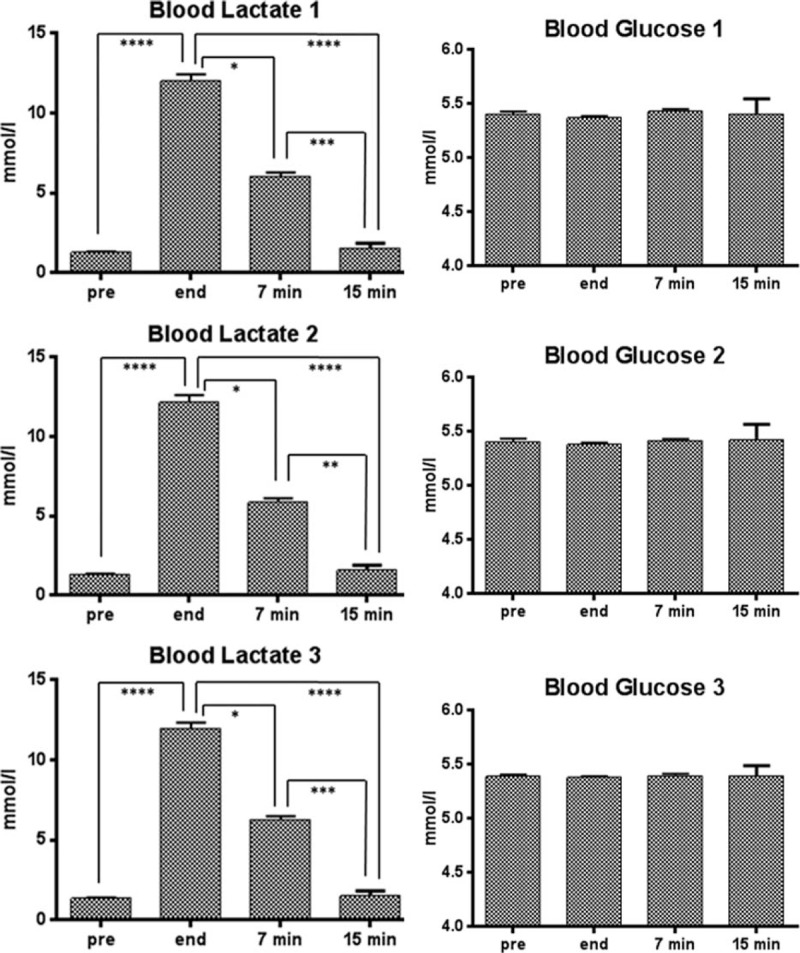
Blood lactate and blood glucose levels ( ± SD) of the 28 subjects performing the acute exhaustive exercise in 3 different days. Lactate and glucose were measured before the exercise (pre), at its conclusion (end), as well as 7 and 15 min after its conclusion. The error bars indicate standard deviation. Symbols from ANOVA with Dunns's Multiple Comparison Test: ∗, P < 0.05; ∗∗, P < 0.01; ∗∗∗, P < 0.001; ∗∗∗∗, P < 0.0001. SD = standard deviation.