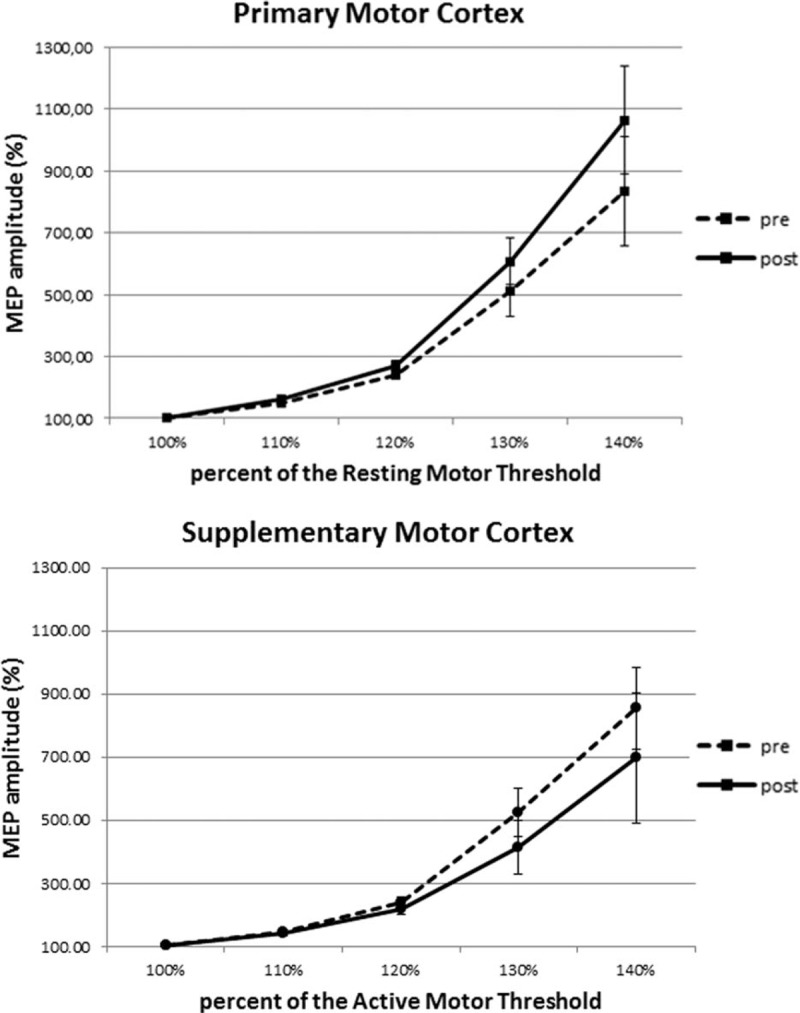
FIGURE 5.

Recruitment curves constructed from the mean amplitudes ( ± SD) of MEPs reported at the 110%, 120%, 130%, and 140% of the resting motor threshold for primary motor area and of the active motor threshold for supplementary motor area. For each cortical area curves obtained before (pre) and at the end (post) of the acute exhaustive exercise are shown. SD = standard deviation.
