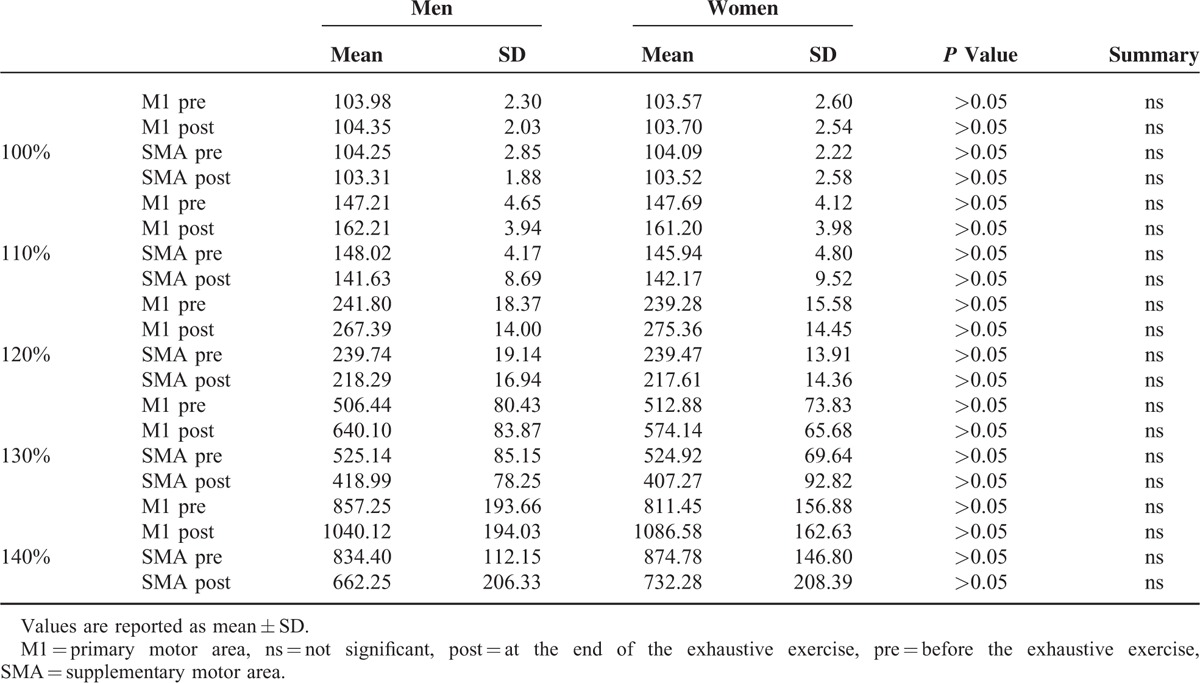
TABLE 4.
Results of Unpaired t Test (2-Tailed) of Data Illustrated in Figure 5, Obtained by Separating Men (N = 14) and Women (N = 14)

Results of Unpaired t Test (2-Tailed) of Data Illustrated in Figure 5, Obtained by Separating Men (N = 14) and Women (N = 14)
