
FIGURE 4.
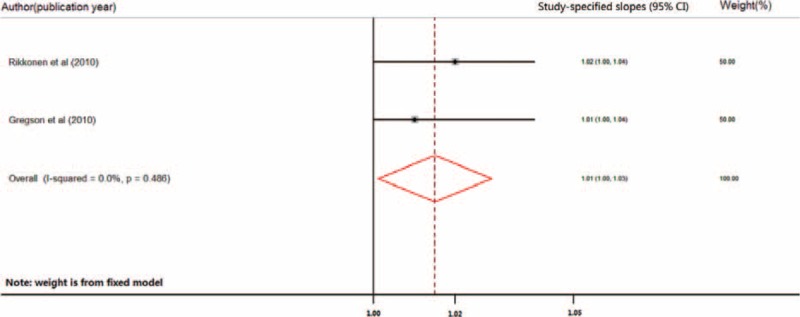
Forest plot (fixed-effect model) of increasing level of physical activity and the risk of wrist fracture of older women. The horizontal line indicates the study-specific 95% confidence interval. The square indicates the study-specific weight from fixed-effect analysis. The diamond indicates the combined relative risk of the 2 included studies after the sensitivity analysis.