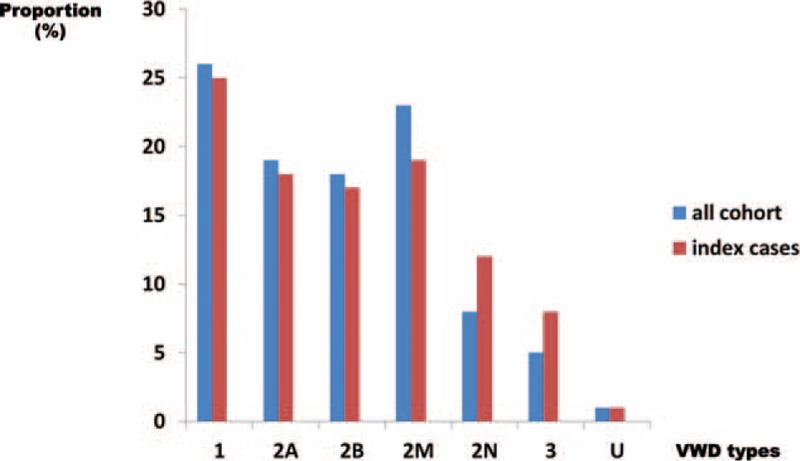
FIGURE 1.

Distribution of von Willebrand disease (VWD) types in the global cohort (n = 1167 patients) and in the index cases (n = 670 cases). The proportion of each VWD type (1, 2A, 2B, 2M, 2N, and 3) is represented with blue histograms for the global cohort of 1167 patients and with red histograms for the 670 index cases (IC). These proportions are similar for both groups of patients within each VWD type. IC = index cases, VWD = von Willebrand disease.
