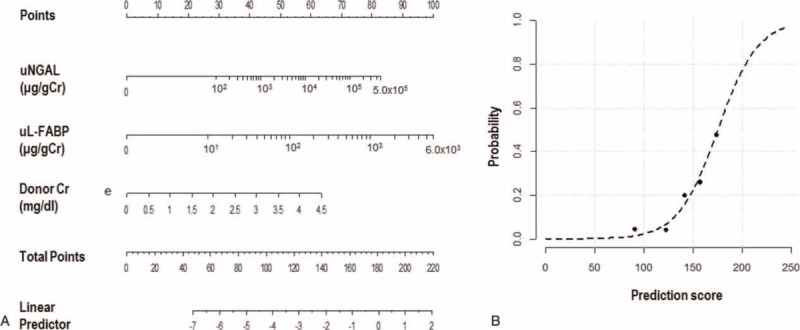
FIGURE 2.

The prediction score of RGF. (A) The prediction score included donor uNGAL, uL-FABP, and serum creatinine. The score for each patient was the sum of the points designated to the 3 predictors. The gradations between 2 numbers in the rulers designated to uNGAL and uL-FABP equally divided the differences between the 2 numbers (e.g., the gradation next to 102 indicates 2 × 10²). (B) Goodness of fit of the prediction score for RGF. The dashed line indicates the predicted probability according to the score, and the black dots indicate the observed frequency of the RGF at the mean scores of each quintile. The observed frequency agreed well with the predicted probability according to the score. (Levenberg–Marquardt nonlinear regression coefficient R2 = 0.967). RGF = reduced graft function, uKIM-1 = urinary kidney injury molecule-1, uL-FABP = L-type fatty acid-binding protein, uNGAL = urinary neutrophil gelatinase-associated lipocalin.
