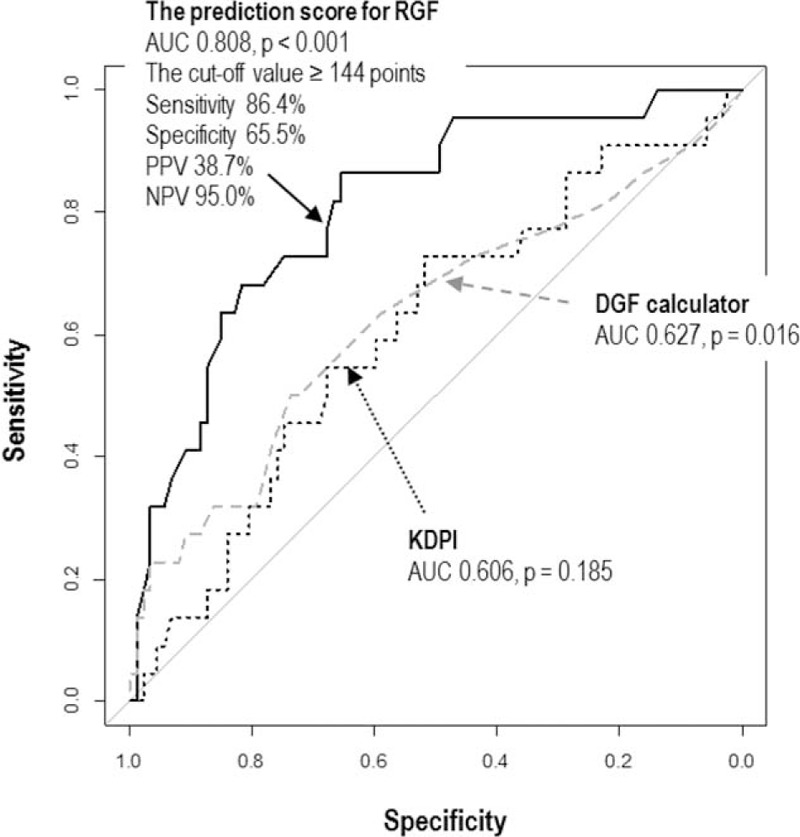
FIGURE 3.

The ROC curves comparing the prognostic capacity of the prediction score with other tools. (A) Score for prediction of RGF (black solid line), (B) DGF risk calculator (gray dashed line), and (C) KDPI (black dotted line). The 95% CI is shown. The area under the ROC curve of the prediction score for RGF is significantly larger than those of the DGF calculator (P = 0.046; DeLong tests) and the KDPI (P = 0.019; DeLong tests). CI = confidence interval, DGF = delayed graft function, KDPI = kidney donor profile index, RGF = reduced graft function, ROC = receiver-operating characteristic,.
