FIGURE 1.

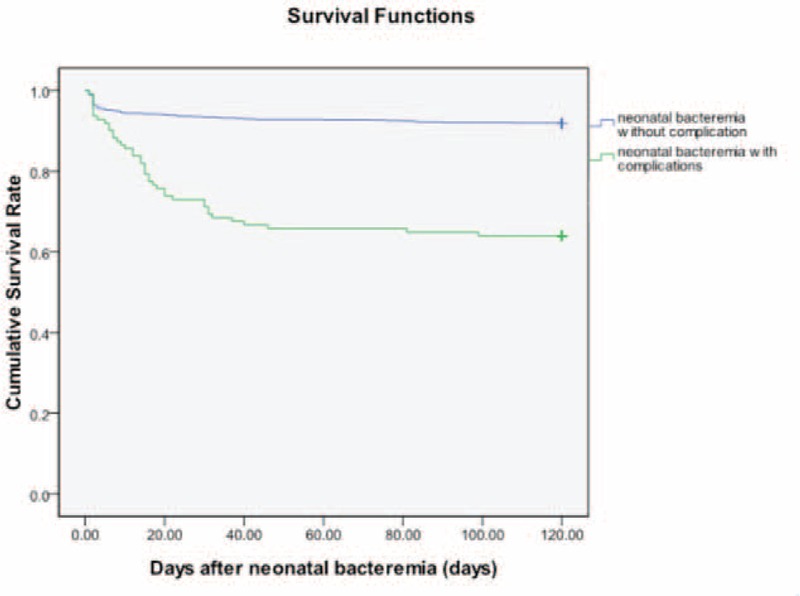
Survival following neonatal bloodstream infections with complications versus those without complications. The y-axis is the proportion surviving (P < 0.001 by log rank test).

Survival following neonatal bloodstream infections with complications versus those without complications. The y-axis is the proportion surviving (P < 0.001 by log rank test).