
Figure 3.
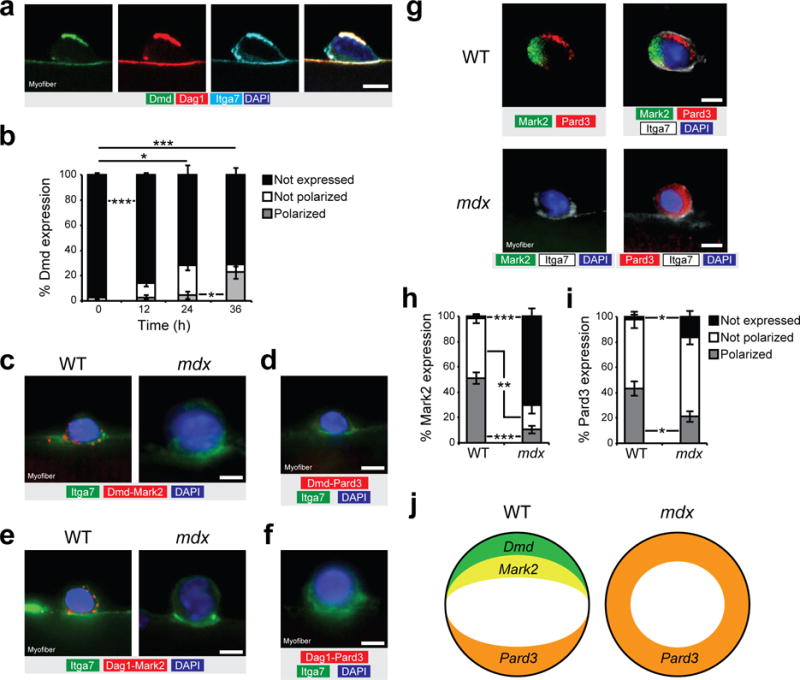
Dystrophin regulates PAR polarity protein localization. (a) Immunostaining for Dmd C-terminal (green), Dag1 (red), itga7 (cyan) and DAPI (blue) of cultured myofiber at 36 h. (b) Quantification of Dmd expression (rod domain) and localization in satellite cells of cultured myofibers of WT mice at 0, 12, 24, and 36 h. Only undivided cells were quantified. n = 3 mice, approx. 50 cells per mice. (c) Representative micrograph (n = 10 micrographs per condition) of proximity ligation assay (PLA) for Dmd (Dy4/6D3 clone) and Mark2 (red) and for (d) Dmd and Pard3 (red), along with immunostaining for itga7 (green) and DAPI (blue) on cultured myofibers from WT and mdx mice at 36 h. n = 3 mice. (e) Representative micrograph (n = 10 micrographs per condition) of proximity ligation assay (PLA) between Dag1 and Mark2 (red), and between (f) Dag1 and Pard3 (red), along with immunostaining for itga7 (green) and DAPI (blue) on cultured myofibers from WT and mdx mice at 36 h. n = 3 mice. (g) Example (n = 10 micrographs per condition) of polarity protein distribution from immunostaining for Mark2 (green), Pard3 (red), itga7 (white) and DAPI (blue) of cultured myofiber from WT and mdx mice at 36 h. n = 3 mice. (h,i) Quantification for (h) Mark2 and (i) Pard3 expression and localization in satellite cells of cultured myofibers of WT and mdx mice at 36 h. n = 4 mice, 30–50 cells per mice. (j) Schematic representation of the polarity establishment in WT and mdx satellite cells. Error bars represent means ± SEM. P* < 0.05, **P < 0.01, ***P < 0.005. Statistical significance was calculated by Student’s t test. Scale bars, 5 μm.