
Figure 3.
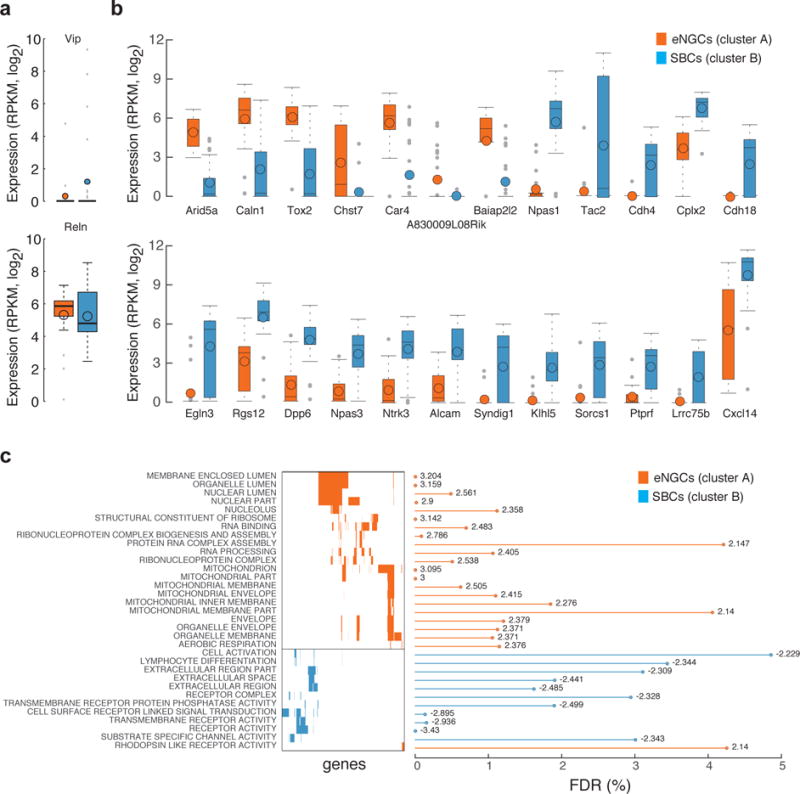
Differential gene expression analysis reveals novel markers for L1 interneuron classes. (a) Boxplots summarize the cell-type expression level of previous marker genes (Vip and Reelin). (b) Boxplots with expression levels across cell types for differentially expressed genes identified between the two affinity propagation clusters. (c) Gene categories that were significantly enriched in SBCs or eNGCs based on gene set enrichment analysis. The gene matrix illustrates gene overlap among categories; the bar plot shows the false discovery rates and the numbers indicate normalized enrichment scores per category from GSEA.