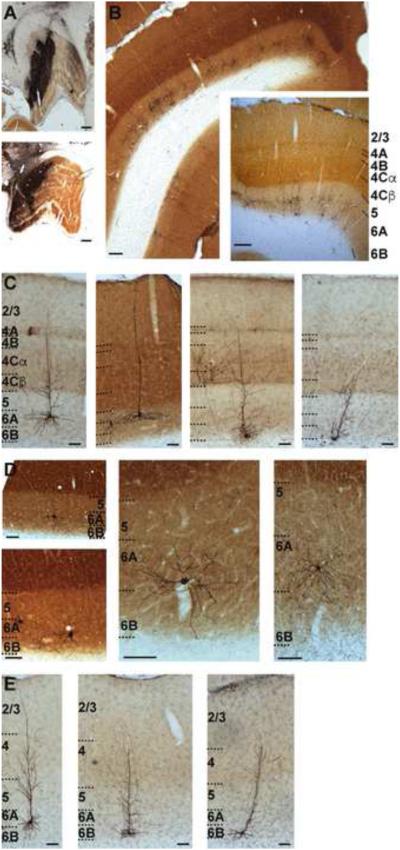
Figure 1.
Injection sites and expression of SADΔG-EGFP in CG neurons. A. Photographs of injections of virus in LGN in two monkeys indicating approximately the largest extent of each injection (see Supplemental Figure 1A for 3-D renderings of complete injection sites). Scale bars are 500 microns. B. Photograph of virus-labeled CG neurons in V1 and V2. Inset is slightly more magnified photograph of labeled CG neurons in V1 to illustrate the sublaminar expression pattern. Scale bars are 200 microns. V1 layers are labeled and indicated by dashed black lines in the inset. Here and throughout, layers 6A and 6B define upper and lower equal halves of layer 6. C. Photographs of 4 example V1 CG neurons. Scale bars are 100 microns. Layers are labeled and indicated by black dashed lines. D. Higher resolution photographs (showing the deep layers only) of less common morphological types of V1 CG neurons (neurons with large cell bodies [left] and spiny stellate neurons [middle, right]). Scale bars are 50 microns. Layers are labeled and indicated by dashed black lines. E. Photographs of 3 example V2 CG neurons. Scale bars are 100 microns. Layers are labeled and indicated by dashed black lines.

