Figure 2.
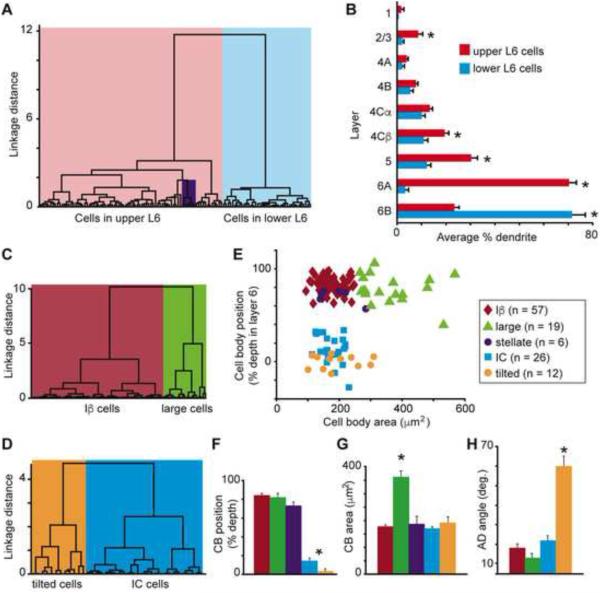
Classifying V1 CG cell types. A. Dendrogram of all V1 CG neurons illustrating the linkage distances, a measurement of clustering, of CG neurons in upper (red) and lower (blue) layer 6 as well as a distinct cluster of spiny stellate neurons within the upper cluster (purple box). B. Histogram of average percentage of BD (layer 6) and AD across V1 layers comparing upper (red) to lower (blue) CG neurons. Error bars represent SEMs. Asterisks illustrate significant differences (Bonferroni corrected to p < 0.007). C. Dendrogram of clustering of non-stellate upper V1 CG neurons into two classes: IB (dark red) and large (green). D. Dendrogram of clustering of lower V1 CG neurons into two classes: IC (blue) and tilted (orange). E. Cell body (CB) position as percent depth in layer 6 (0 is white matter border, 1 is layer 5/6 border) versus CB size (square microns) for all V1 CG neurons (labeled according to legend). F. Histogram of average CB position as percent depth in layer 6 for V1 CG neurons. Error bars represent SEMs, asterisk indicates that IC and tilted cells are deeper than upper CG neurons (p = 5.1×10⁻⁷). G. Histogram of average CB size (square microns) for V1 CG neurons. Error bars represent SEMs, asterisk indicates that large cells have larger cell bodies than all other V1 CG neurons (p = 2.2×10⁻⁹). H. Histogram of average AD angle (degrees relative to vertical) for all V1 CG neurons. Error bars represent SEMs, asterisk indicates that tilted cells have greater AD angles than all other V1 CG neurons (p = 4.6×10⁻⁸).

