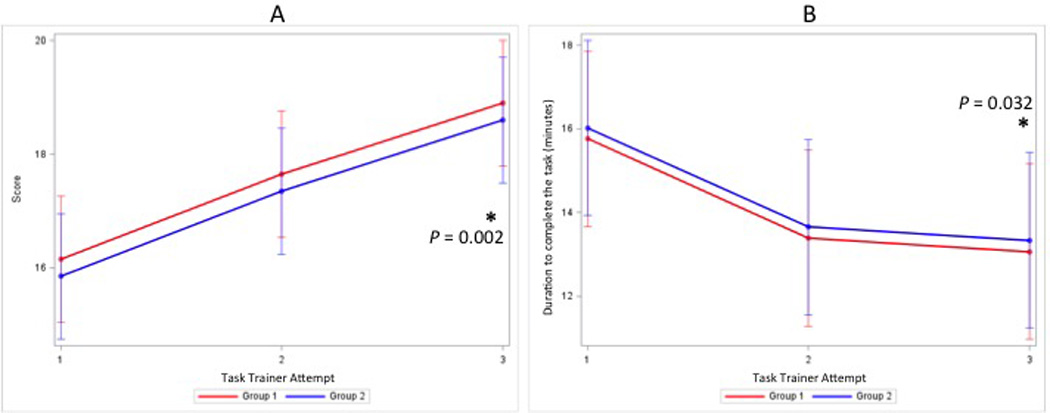
Figure 4.

Estimated mean (±SE) score (0 – 21) (A) and duration to complete the task in minutes (B) between groups and over three epidural placement attempts. A mixed model analysis was performed to determine differences in scores and duration between groups and over time. Post hoc comparisons were made using Type III Tests of Fixed Effects with Bonferroni correction. The asterisk (*) denotes a P<0.05 for the third attempt compared to the first attempt within each group.
