
Figure 2. Nonlinear interaction depends on stimulus contrast.
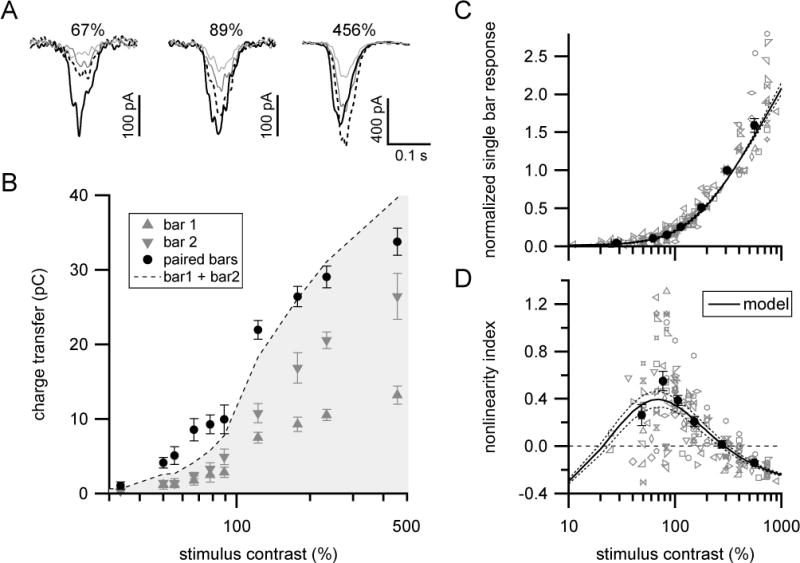
(A) Mean excitatory currents in response to single (gray) or paired (black) bar presentations at different stimulus contrasts in an example ON-S RGC. Dashed lines shows sum of single bar responses.
(B) Contrast-response relationship for same cell shown in (A). Symbols and error bars show mean±SEM. Filled black circles that fall above (within) the grayed area indicate supralinear (sublinear) interactions.
(C) Population summary of single bar contrast-response relationship. Gray symbols show data from individual cells. Filled circles with error bars are mean±SEM across cells (n=19 cells) for data collected into approximately equal sized bins by contrast. Responses were normalized to the response at 315–450% contrast. Solid black curve and dotted lines show mean and SEM, respectively of bipolar population model output (see Figure 5 and associated text; xhalf =71±9% contrast, h=2.18±0.16, σbipolar=14±2% contrast).
(D) Population summary of nonlinearity index versus stimulus contrast for same cells shown in (C). Line styles and symbols same as in (C). See also Figures S2, S4 and S5.