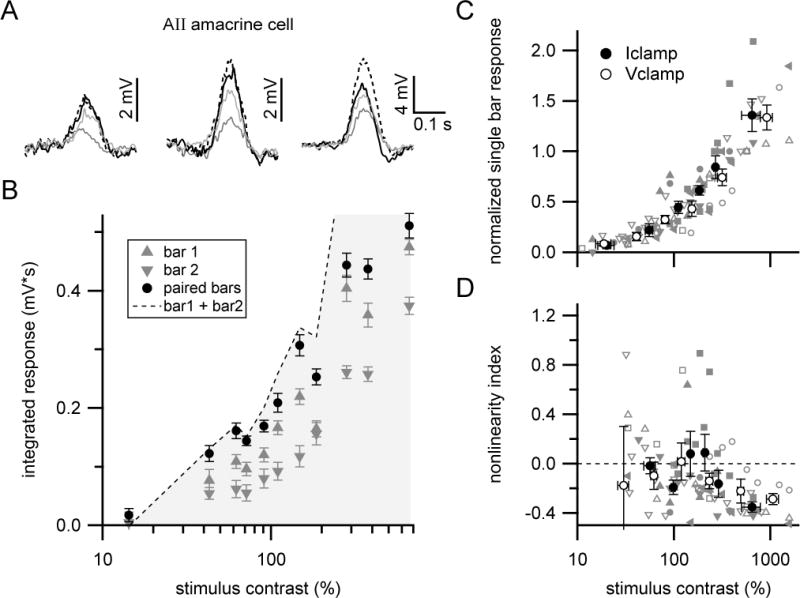
Figure 4. Linear or sublinear responses in AII amacrine cells.

(A) Mean voltage responses at different stimulus contrasts in an example AII amacrine cell (flat mount retina). Resting membrane potential = −47 mV. Stimulus contrasts (left to right): 62, 110 and 281%.
(B) Contrast-response relationship for cell shown in (A). Symbols show mean±SEM.
(C) Summary of AII amacrine cell responses across contrasts. Filled gray symbols (single cell) and filled black circles with error bars (mean±SEM) show data from current-clamp recordings (n=5 cells; resting membrane potential = −48±2 mV). Open gray symbols (single cell) and white circles with error bars (mean±SEM) are from voltage-clamp recordings (n=4 cells).
(D) Summary of nonlinearity index versus stimulus contrast. Same symbol and color scheme as in (C).
