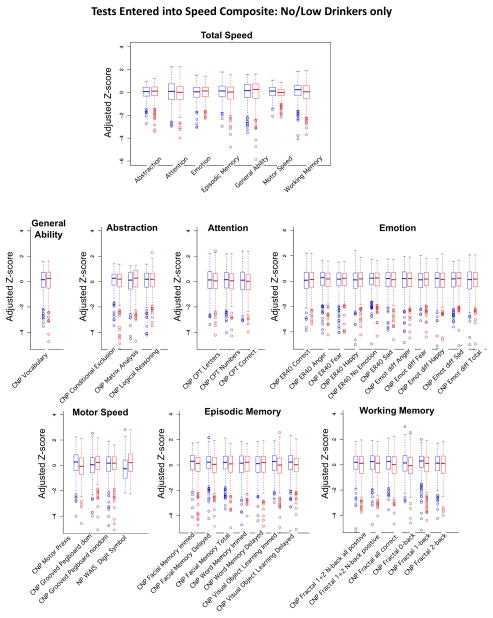
Figure 2.
Speed composite scores. Box plots of Z-scores adjusted for site, ethnicity, and SES of the no/low-drinking male (blue) and female (red) participants. The top figure presents the summary scores for each of the 7 composite scores determining the Total Speed composite score. The remaining 7 sets of box plots show the individual measures that were entered into each speed composite score.

