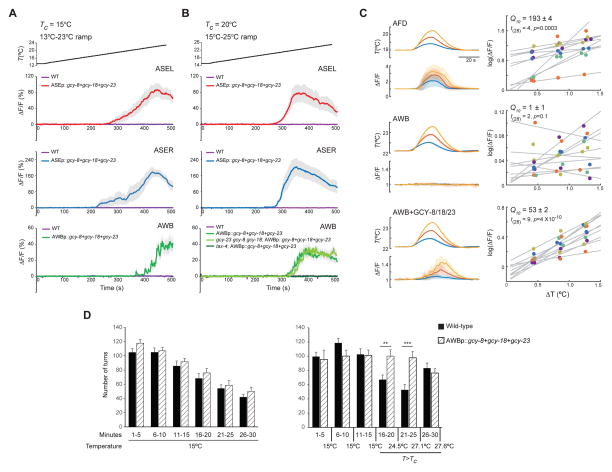
Figure 2. AFD-rGCs confer thermosensitivity upon ectopic expression in chemosensory neurons.
A–B) Average fluorescence changes in ASEL, ASER and AWB neurons expressing GCaMP3 in the indicated genetic backgrounds, and/or upon ectopic expression of gcy-8, gcy-18 and gcy-23 to the shown rising temperature stimuli (black lines at top, 0.02°C/sec). Alleles used were tax-4(p678), gcy-8(oy44), gcy-18(nj38) and gcy-23(nj37). Errors are SEM. n = 9–10 neurons each. Responses are pooled and averaged from two independent transgenic lines for each case. Also see Table S1.
C) GCaMP3 fluorescence changes in AFD (top), AWB (middle) and AWB neurons misexpressing GCY-8, GCY-18 and GCY-23 (bottom) in response to temperature transients. Traces at left show mean temperature transients and normalized fluorescence changes (ΔF/F) for three nominal temperature transients (ΔT = 0.4°C - blue, 0.8°C - red, 1.2°C - yellow) from a holding temperature (Thold: AFD = 19.0°C, AWB = 22.1°C). Errors are SD. n=10 neurons each. Tc=20°C. Scatter plots at right show log mean peak fluorescence amplitudes for each temperature transient. Responses from individual animals are color coded. Lines are linear regression fits for each animal. The effective Q10 is shown ±95% confidence intervals, computed for each condition by fitting a mixed-effects linear model.
D) Average turn numbers (±SEM) exhibited by wild-type (solid bars) or transgenic (hatched bars) animals expressing all three AFD-rGCs in AWB under the str-1 promoter. Non-GCaMP-expressing siblings of transgenic animals used in A and B above were examined. Animals were either maintained at 15°C (left) or subjected to a 15°C-28°C rising ramp (right). Turns are binned into 5 min intervals. Monitored temperature on the plate surface at the indicated times are shown. ** and *** - different from corresponding wild-type at P<0.01 and 0.001 (t-test), respectively. n=10 experiments of 15 animals each.

