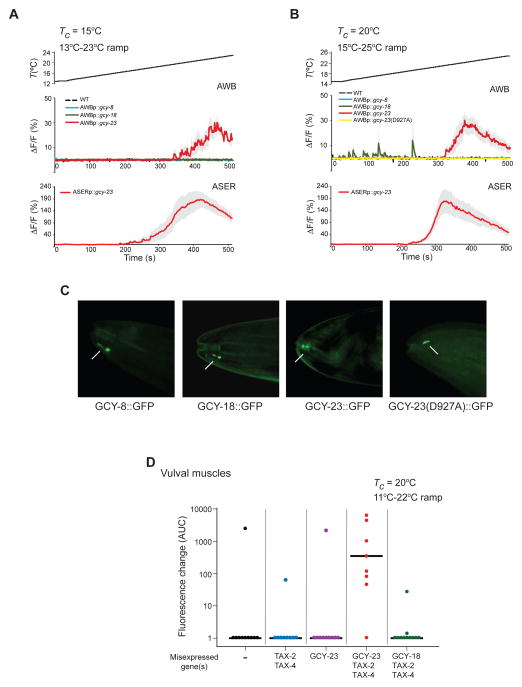
Figure 3. GCY-23 confers responses in the physiological temperature range upon ectopic expression in neurons and muscles.
A–B) Average fluorescence changes in AWB and ASER neurons expressing GCaMP3 and/or the indicated genes to the shown rising temperature stimuli (black lines at top, 0.02°C/sec). Errors are SEM. n = 7–10 neurons each. Responses are pooled and averaged from two independent transgenic lines each. Control data in A–B are repeated from Figure 2A–B for comparison and are indicated by dashed lines. Also see Figure S2 and Table S1.
C) Representative images showing localization of GFP-tagged AFD-rGC proteins at the distal dendritic ends of AWB (arrows). Anterior is at left. Scale bar: 10 μm.
D) Scatter plot showing GCaMP3 fluorescence changes in vulval muscles in individual animals expressing GCaMP3 and/or the indicated genes to a rising temperature stimulus (0.02°C/sec). Area under the curve (AUC) was calculated from the first 60 sec of the response following the first response above threshold. See Figure S3 for calcium responses of individual animals. rGC and tax-2/4 cDNAs were expressed under the unc-103e or myo-3 promoters, respectively. Horizontal black bars indicate the median. n = 8–10 neurons each. Responses are pooled and averaged from at least two independent transgenic lines each.

