
Fig. 1.
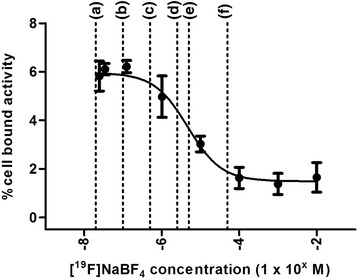
Inhibition curve for blocking [18F]BF4 − accumulation with 19F-BF4 − in vitro in HCT116-hNIS-C19 cells. Dashed lines labelled (a) to (f) represent estimated prospective in vivo initial extracellular concentrations of 18/19F-BF4 − at varying SA following injection of ~2.5 MBq radiotracer into a mouse: (a) 5 nmol/kg, (b) 25 nmol/kg, (c) 125 nmol/kg, (d) 625 nmol/kg, (e) 1250 nmol/kg and (f) 12.5 μmol/kg. Error bars represent 1 SD