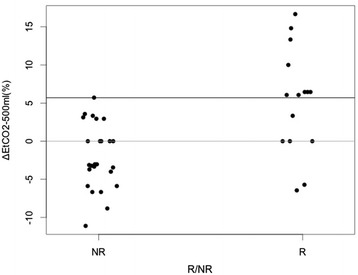
Fig. 3.

EtCO2 variation in responder and non-responder. Variation of end-tidal carbon dioxide after 500 ml (ΔEtCO2-500 ml), responders (R) defined as patients who increased cardiac index more than 15 % after fluid expansion and non-responders (NR) defined as patients who increased cardiac index <15 % after fluid expansion
