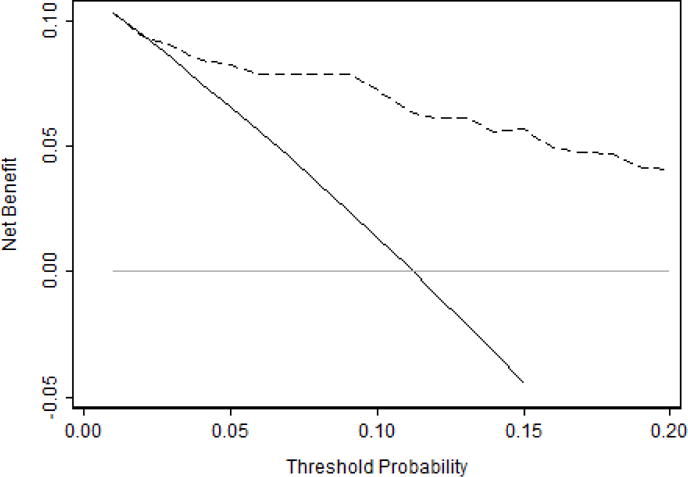
Figure 1.

Decision curve for predicting high-grade cancer on confirmatory biopsy. Dashed line is the net benefit of providing a confirmatory biopsy based on PSA density, MRI results, percent positive cores, total tumor length and percent cancer; black line is the net benefit of providing all patients with a confirmatory biopsy; and grey line is the net benefit of providing no patients with a confirmatory biopsy. The curve shows that the net benefit of using the model to choose who receives confirmatory biopsy exceeds the benefit of performing confirmatory biopsy except for urologists with extremely low threshold probabilities less than 2%.
