
Figure 6.
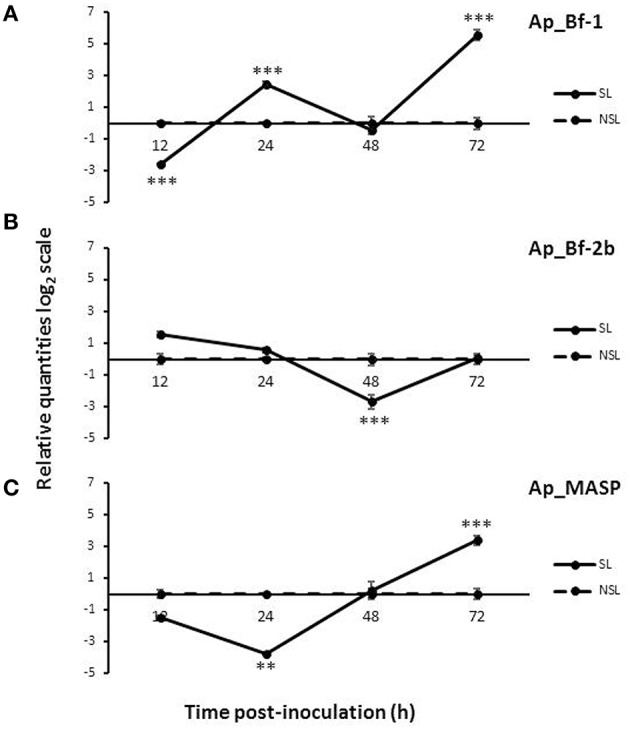
Expression of Ap_Bf-1, Ap_Bf-2b, and Ap_MASP during the recolonization experiment for symbiont+light (SL) and no symbiont+light (NSL) treatments. (A) Ap_Bf-1, (B) Ap_Bf-2b, and (C) Ap_MASP). Bars represent means ± SE (n = 3) and stars (*) represent expression differences that are significantly different between the SL and NSL treatments at a particular time point (ANOVA, Tukey's post-hoc test). *p < 0.05, **p < 0.01, ***p < 0.001.