
Figure 7.
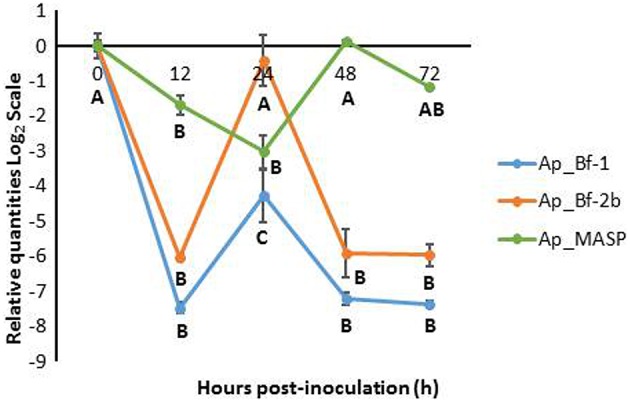
Expression of Ap_Bf-1, Ap_Bf-2b, and Ap_MASP during the recolonization experiment for symbiont+dark treamtment (SD). Bars represent means ± SE (n = 3) and letters represent expression differences that are significantly different between time points within each gene (ANOVA, Tukey's post-hoc test).