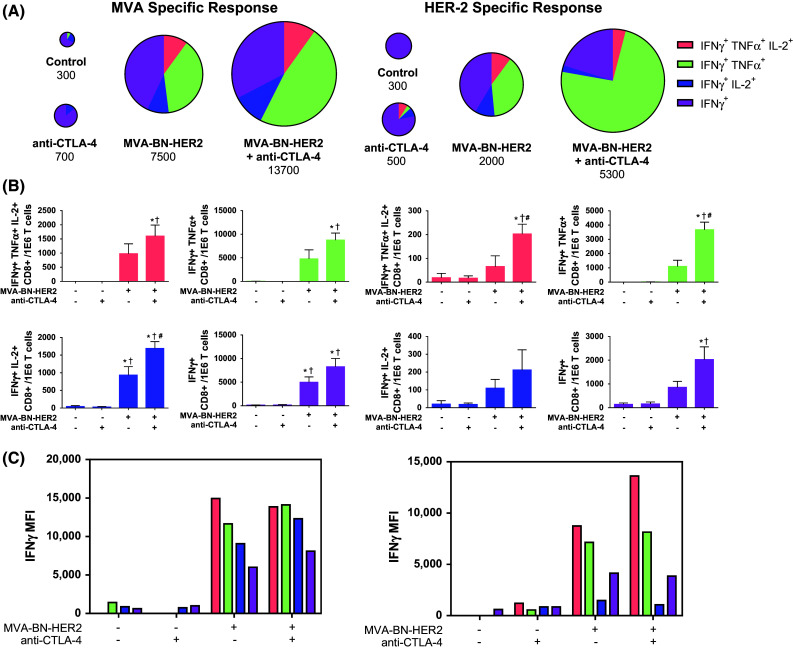
Fig. 4.

Antigen-specific cytokine production in CD8 T cells in the spleen. a Cytokine production in the spleen of mice treated with MVA-BN-HER2 and/or CTLA-4 blockade. Pie charts are area-weighted to reflect the number of CD8+ IFNγ+ cells per million T cells. b IFNγ, TNFα, and IL-2 subsets of cytokine+ T cells shown in a. c IFNγ MFI plotted for the subsets of cytokine+ T cells shown in A. Data combined from 5 experiments. In each experiment, splenocytes of 4–10 mice/group were pooled. p < 0.05: * versus control, † versus anti-CTLA-4, and # versus MVA-BN-HER2
