
Figure 3.
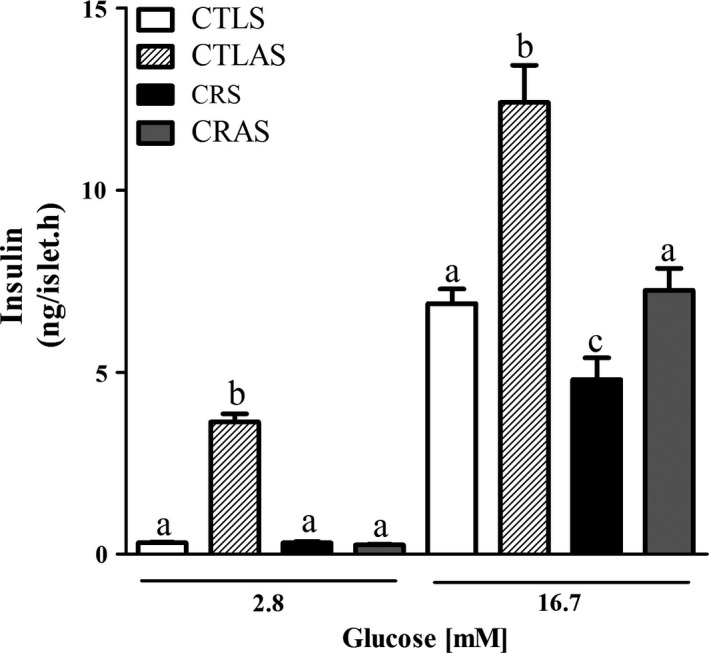
Glucose‐induced insulin secretion in isolated islets from CTLS, CTLAS, CRS and CRAS rats. Groups of 4 islets were incubated for 1 h with different glucose (G) concentrations as indicated by horizontal lines. Each bar represents the mean ± SEM of 12–35 groups of islets. Different letters (a, b and c) represent significantly different results using the indicated glucose concentrations, P < 0.05.