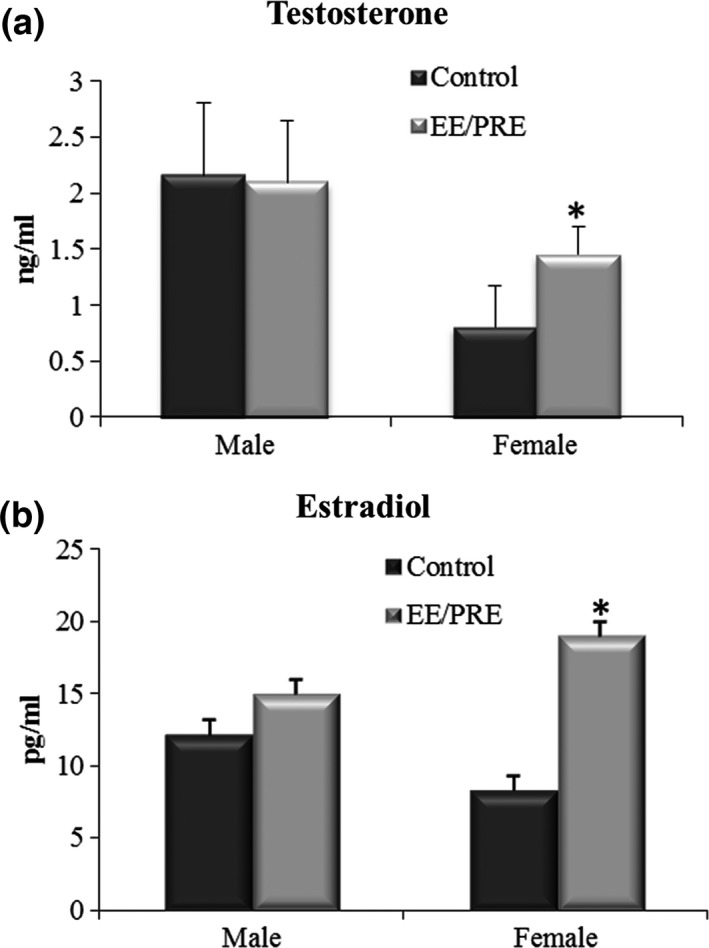
Figure 2.

Serological data for the male and female of senile gerbils from the experimental groups. (a) Testosterone levels (ng/ml). (b) Estradiol levels (pg/ml). Values expressed as mean ± SD (n = 5). *Significant difference between the groups with P ≤ 0.05.
