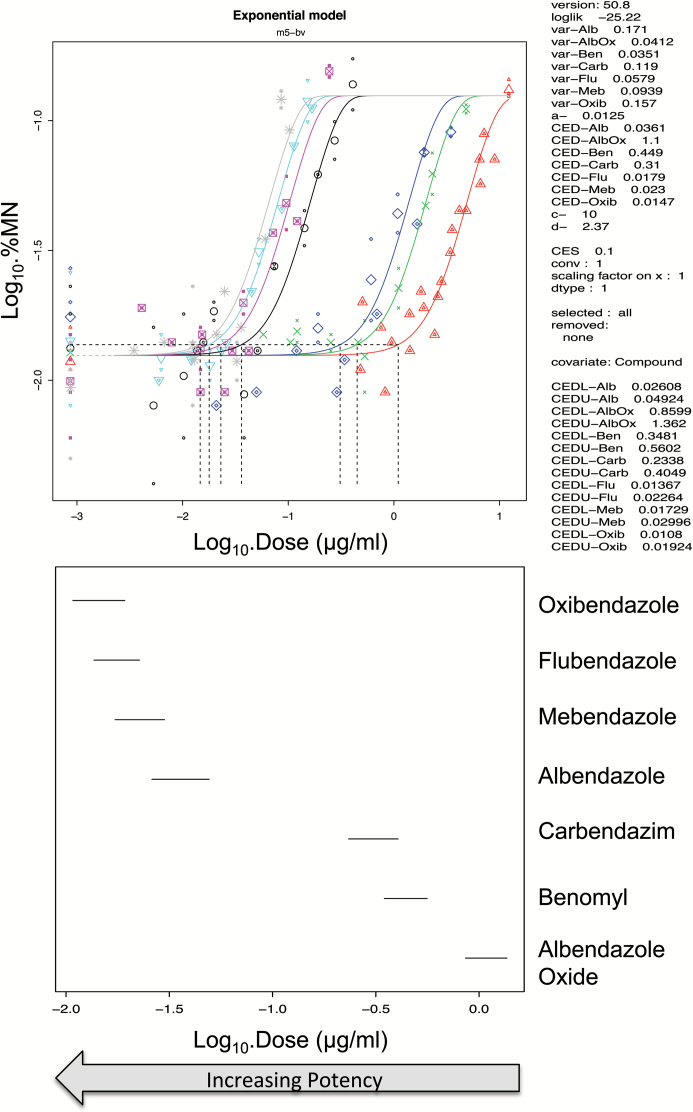
Figure 2.
BMD10 analysis of in vitro MN dose responses in Chinese hamster ovary (CHO-K1) cells following exposure to the benzimidazoles, oxibendazole (grey), flubendazole (light blue), mebendazole (pink), albendazole (black), carbendazim (dark blue), benomyl (green) and albendazole oxide (red) (19). The figure was modified from the article (37). The top figure shows that the four parameter (m5-bv) exponential model provided a suitable fit to each dose response using the compound as covariate for BMD analysis. The dotted lines show the BMD10 derivations for each dose response, and these correspond to the mid-point for each line plotted in the bottom figure. These lines in the bottom graph span the BMDL10 to the BMDU10 derived from the top figure using PROAST v50.8. Flubendazole, oxibendazole and mebendazole grouped together along with albendazole. Benomyl and carbendazim also grouped together with albendazole oxide being a lot less potent and forming no groupings. The individual plots are located in supplementary Figure 2.

