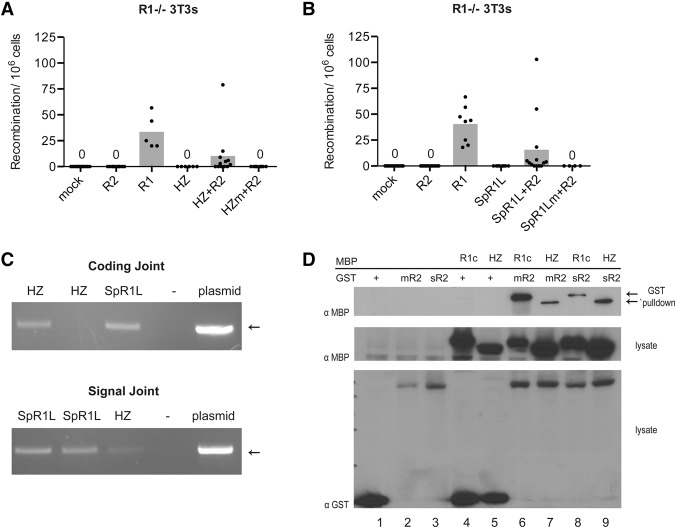
Figure 3.
Recombination mediated by HzTransib and purple sea urchin RAG1-like. (A,B) Quantitation of recombination in RAG1−/− 3T3 fibroblast lines. Recombination efficiency is plotted as in Figure 1B. Note that levels of recombination by RAG1 alone in this RAG1−/− line were higher than in wild-type and RAG2−/− lines. (Mock) Empty vector control; (HZ) Hztransib; (SpR1L) spRAG1L; (HZm) active site mutant of Hztransib; (SpR1Lm) active site mutants of spRAG1L. (C) Representative PCR assays for coding or signal joints in genomic DNA from MPA-resistant cells expressing the indicated proteins. Each lane is an independent clone. (Plasmid) Reaction spiked with positive control template DNA; (HZ) Hztransib; (SpR1L) spRAG1L. (D) GST pull-down to detect interactions between the indicated MBP- or GST-tagged proteins. (R1c) RAG1 core; (Hz) HZTransib; (mR2) mouse RAG2; (sR2) shark RAG2; (+) GST alone. (Top) Glutathione pull-down. (Middle and bottom) Starting material lysate. Arrows indicate the expected positions of MBP-RAG1 core and MBP-Hztransib proteins.

