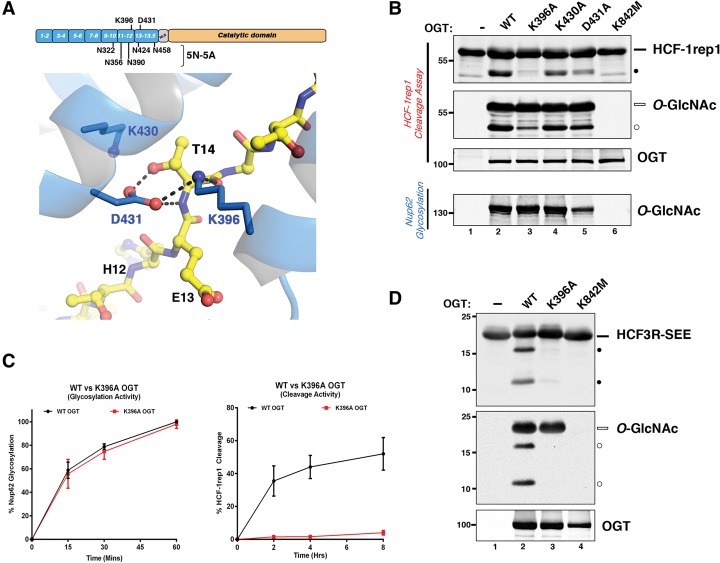
Figure 3.
TPR domain point mutations at the TPR–Cat domain interface selectively impact HCF-1 proteolysis. (A, top) Domain representation of OGT: The positions of the five conserved asparagine residues replaced with alanines in the 5N-5A mutant (below) as well as residues K396 and D431 (above) are shown. Structural representation: HCF-1PRO repeat 2 residue T14 interactions with K396 (TPR 12) and D431 (TPR 13) of the OGT TPRs. The OGT TPR domain and its residues are shown in blue, and the HCF-1PRO repeat is shown as a yellow ball and stick representation. Interactions between T14 and OGT TPR residues are illustrated as black dashed lines. (B) HCF-1rep1 or Nup62 was incubated with wild-type or mutant OGTs and assayed for in vitro HCF-1 proteolysis and glycosylation or Nup62 glycosylation. HCF-1rep1 cleavage was detected with the anti-GST antibody, whereas HCF-1rep1 and Nup62 glycosylation was detected with the anti-O-GlcNAc RL2 antibody. Anti-OGT was used to detect OGT protein. (C) Graph depicting the Nup62 glycosylation (left) and HCF-1rep1 cleavage (right) activities of wild-type OGT and K396A OGT (Supplemental Fig. 3C,D). Glycosylation and cleavage efficiencies were calculated as described in the Materials and Methods. n = 3, ±SD. (D) HCF3R-SEE was incubated with wild-type, K396A, and K842M OGT to assay cleavage (top panel) and glycosylation (middle panel). Anti-O-GlcNAc RL2 antibody was used to detect HCF3R-SEE glycosylation, and anti-His and anti-OGT antibodies were used to detect total HCF3R-SEE and OGT protein, respectively. (Black bar) Uncleaved HCF-1rep1 substrate; (black circle) cleaved product; (white bar) glycosylated uncleaved HCF-1rep1 substrate; (white circle) glycosylated cleaved product.

