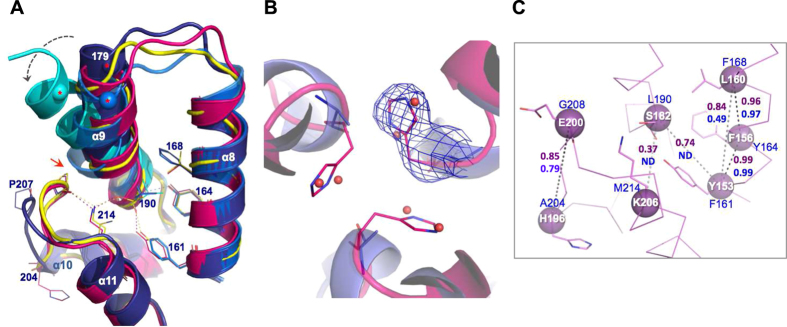
Figure 3. Structural basis of correlated substitutions.
(A) Superposition of CACTD of FIV (magenta), EIAV (yellow, 1EIA), HIV-1 native (dark blue, 4XFX), dehydrated (blue, 4XFY) and domain-swapped (cyan, 2ONT) forms. HIV-1 residue numbering is shown. Dynamic N-terminus of α-9 (spheres with red asterisks: Cα of E179) is highlighted with a dashed gray arrow. Red arrow stresses steric hindrance between HIV P207 and α-9 bulge. Interactions are shown in dashed lines colored yellow (EIAV), blue (HIV) or magenta (FIV). Residue 190 denotes the static C-terminus base of α-9. (B) Trimeric CA interface of FIV (magenta) modeled per native HIV-1 structure (dark blue, 4XFX). HIV A204 (blue lines) and water molecules (red spheres) and FIV H196 (magenta lines) are shown. FO-FC map (blue mesh, 2.5 σ) calculated after omitting H196 of FIV CA. (C) Correlated residues of FIV CA (magenta ribbon) are presented in magenta spheres (Cα) and side chains (lines). Residue numbering of FIV (white font) and HIV-1 (blue font) are shown. Correlated pairs are coupled with dashed lines of black (high score) or gray (weaker score) colors and the Gremlin’s probability score5 is shown in magenta (FIV) and blue (HIV-1) font. ND: not detected.

