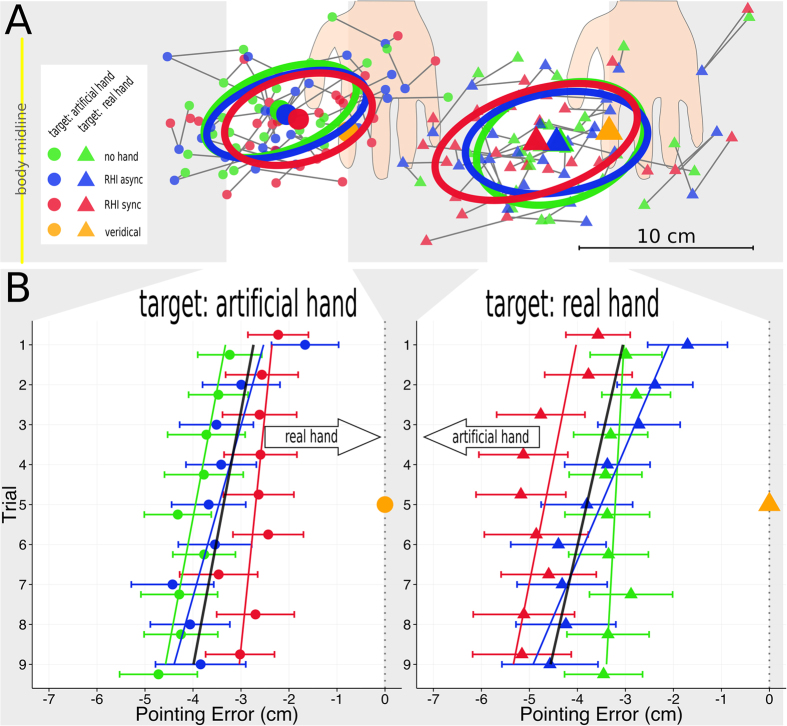
Figure 3.
(A) Descriptive results from the localization tasks. The gray area of panel A corresponds to the area highlighted in Fig. 1 (annotated with the number 5) and shows aggregated localization data from both experiments in one plot. Movement endpoints were averaged over 9 trials in the three conditions. Mean values belonging to the same participant are interconnected with thin gray lines. Large symbols represent group means. Ellipses indicate 50%-borders of the estimated bivariate normal distribution. Orange symbols indicate veridical target positions. The two sections highlighted in light gray are magnified in panel B. (B) Pointing error along the horizontal dimension for the 9 trials separately. Note that, in accordance with panel A, pointing errors are depicted on the horizontal (x) axis and trials are represented by the vertical axis (starting with trial 1 on the top of the figure). Negative pointing error values indicate medial displacements (displacements from the target towards the body midline) and positive values lateral displacements. Symbols represent mean pointing errors; error bars represent standard errors of the mean; lines represent linear regression fit for all conditions together (black) and each condition separately (colored). Large orange symbols indicate x-positions of veridical targets.

