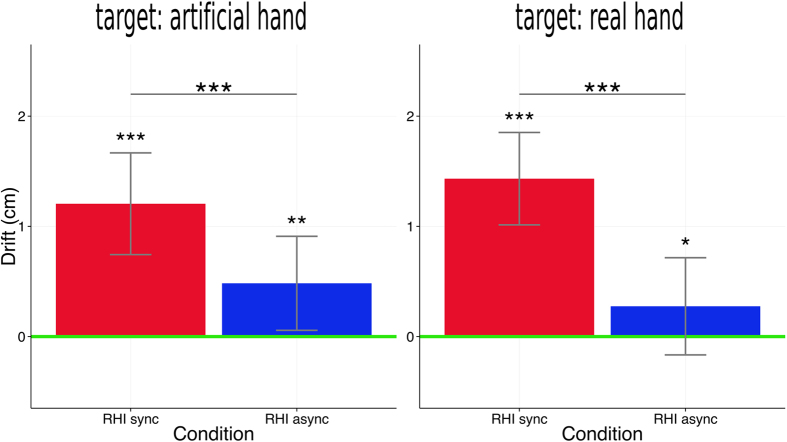
Figure 4. Proprioceptive drift in both experiments.
Red bars indicate the mean differences between the “RHI sync” condition and the “no hand” condition and blue bars between the “RHI async” condition and the “no hand” condition. Positive values reflect drift into the hypothesized direction (towards the artificial hand in the “target: real hand” and towards the real hand in the “target: artificial hand” experiment). The means were computed by first aggregating the differences between the conditions per trial intra-individually over the 9 trials and then over the participants. The zero-line (shown in green) therefore represents the “no hand” condition. Error bars indicate standard errors of the mean (of the intra-individually aggregated values). Statistical annotations (asterisks) refer to the results of the post-hoc tests that were computed subsequent to the linear mixed models. The annotations belonging to the bars summarize p-values referring to the comparison to the “no hand” condition (*p < 0.05; **p < 0.01; ***p < 0.001).

