
Figure 6. PMF along the distance change in different mutants.
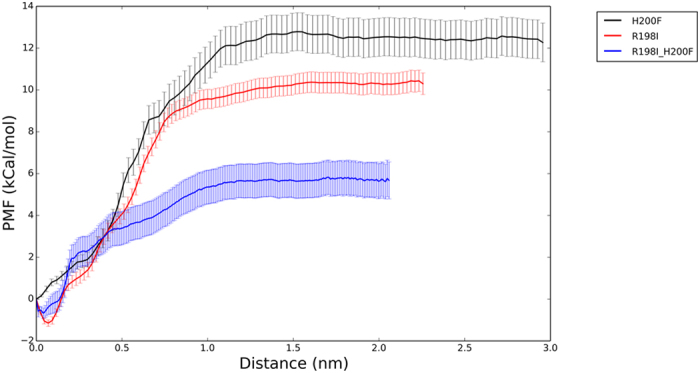
The distance change is calculated by initial distance between insulin and IGFBP7. Black and red lines represent H200F and R198I mutants, respectively. Blue line is for double mutants. Error bars are shown on each lines.