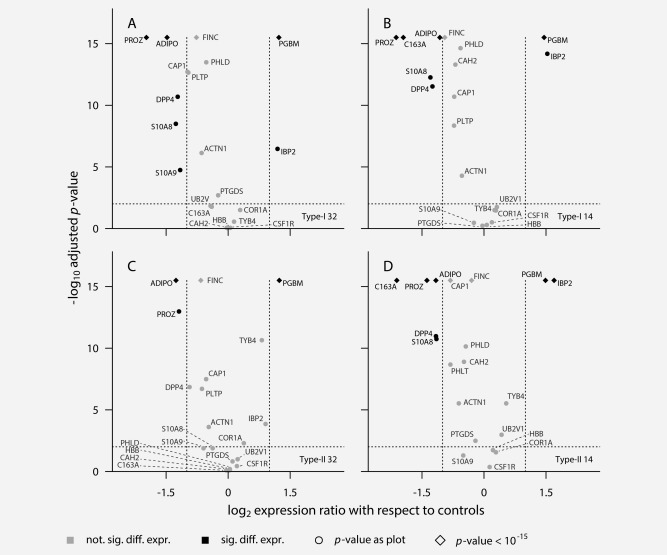
Figure 1.

Volcano plots comparing differential expression of the 20 putative early detection biomarkers versus control levels across the ovarian cancer sub types and time points under investigation. The horizontal dotted line is the 95% confidence interval. Proteins to the right of the right hand vertical dotted line are at least twofold increased in expression compared with control. Proteins to the left of the left hand vertical dotted line are at least twofold decreased in expression compared with control. (a) Expression of proteins for Type I ovarian cancer at the farthest point from diagnosis (>32 months). (b) Expression of proteins for Type I ovarian cancer at the earlier point from diagnosis (<14 months). (c) Expression of proteins for Type II ovarian cancer at the farthest point from diagnosis (>32 months). (d) Expression of proteins for Type II ovarian cancer at the earlier point from diagnosis (<14 months).
