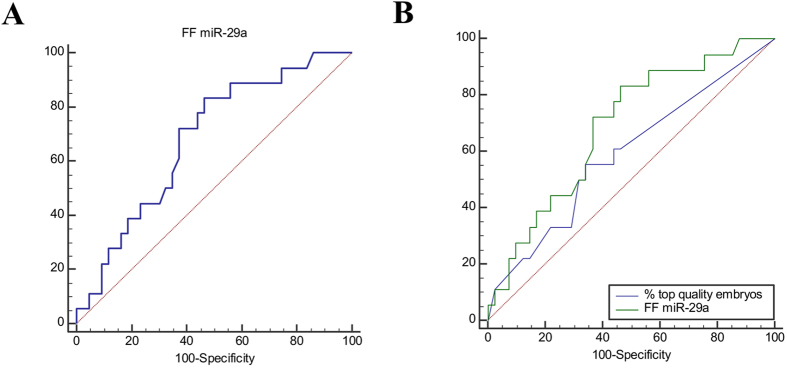
Figure 5.
(A) ROC analysis to evaluate FF miR-29a expression predictive value for clinical pregnancy outcome. (B) Comparison of the ROC curves showing the predictive value of FF miR-29a expression and top quality embryo proportion for clinical pregnancy outcome. These analyses included only the group of women with normal ovarian reserve (n = 91).

