
Figure 3.
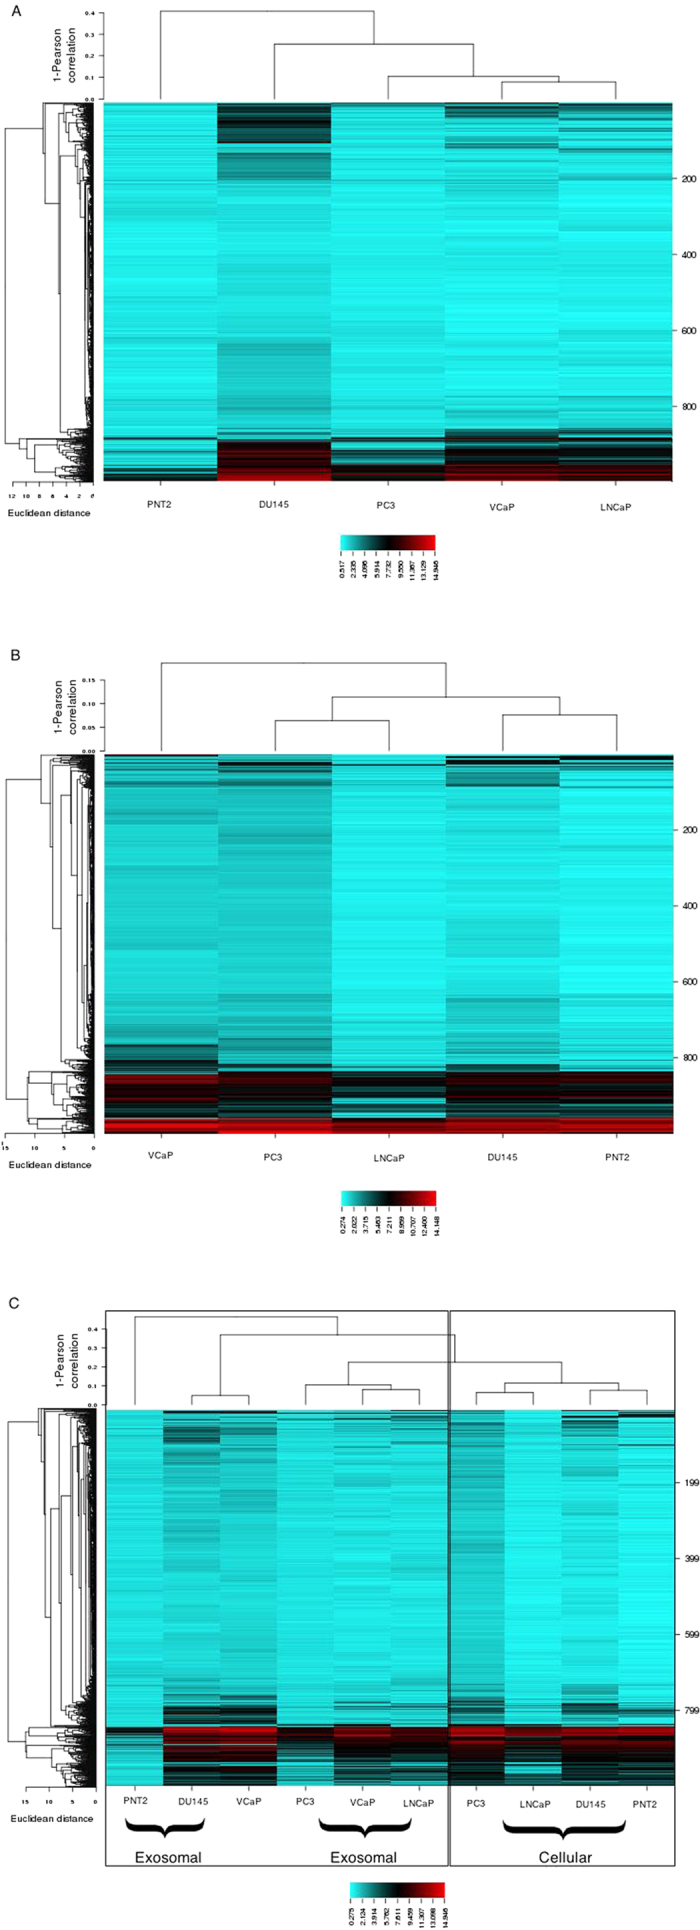
(A) miRNA heatmap in exosomes representing prostate cancer and PNT2 normal cell lines. Aqua colour represents reduced levels and Red is indicative of high expression. (B) Differential expression of miRNAs in the parental five cell lines. (C) Heatmap showing the expression of miRNA in both exosomes and their parental cell line.