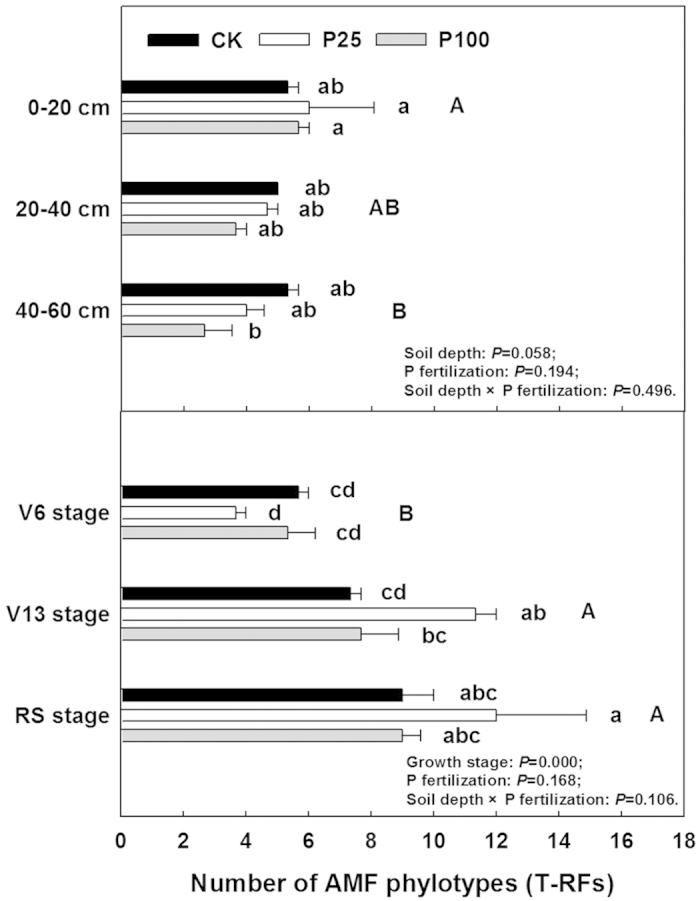
Figure 1. Richness of fungal T-RFs in soil at different depths and maize roots of different growth stages in different P treatments.

Bars represent mean values ± SE (n = 4). Significant differences among treatments and soil depths were tested using Duncan’s multiple range test (p < 0.05) and are indicated by different lowercase or capital letters.
