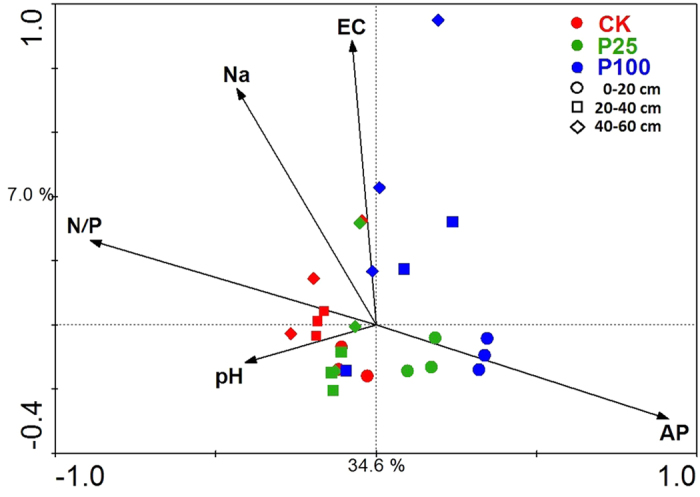
Figure 2. Canonical correspondence analysis (CCA) of the AM fungal community composition in the soil in response to vectors of significant soil chemical properties.

CK: zero P application (control); P25: 25 kg P ha−1; P100: 100 kg P ha−1. Solid circles represent 0–20 cm, solid squares represent 20–40 cm, and solid diamonds represent 40–60 cm soil depth, respectively. The first and second axes explain 34.2 and 7.0% of the variance. The Monte Carlo test of significance of the first canonical axis and all canonical axes are p = 0.002 (F = 6.238) and p = 0.002 (F = 2.372), respectively.
