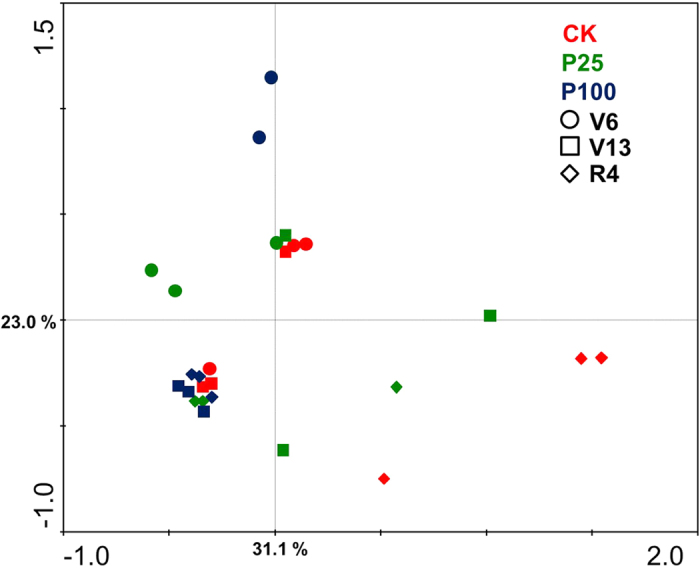
Figure 3. Principal component analysis (PCA) of the AM fungal community composition in the maize root in response to different growth stages.

CK: zero P application (control); P25: 25 kg P ha−1; P100: 100 kg P ha−1. Solid circles represent the V6 stage, solid squares represent V13 stage, and solid diamonds represent the R4 stage. The first and second axes explain 31.1 and 23.0% of the variance.
